
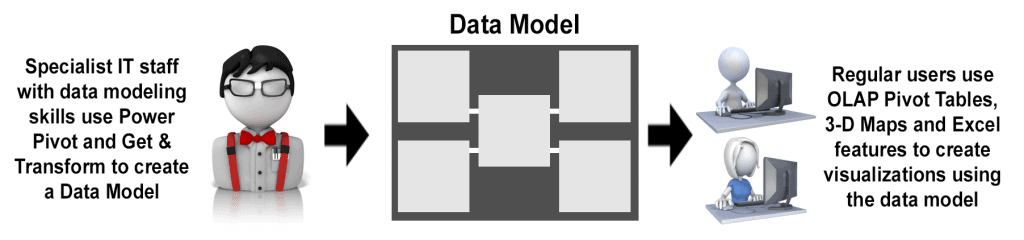
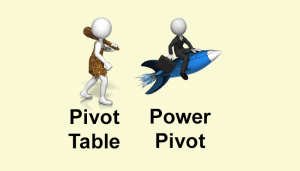
Excel modern data analysis
This article describes a new way of working with Excel called “modern data analysis” enabled by the new Get & Transform and Power Pivot tools.
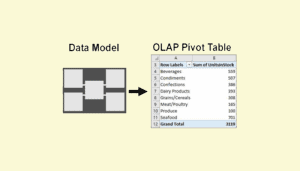
Excel OLAP pivot tables
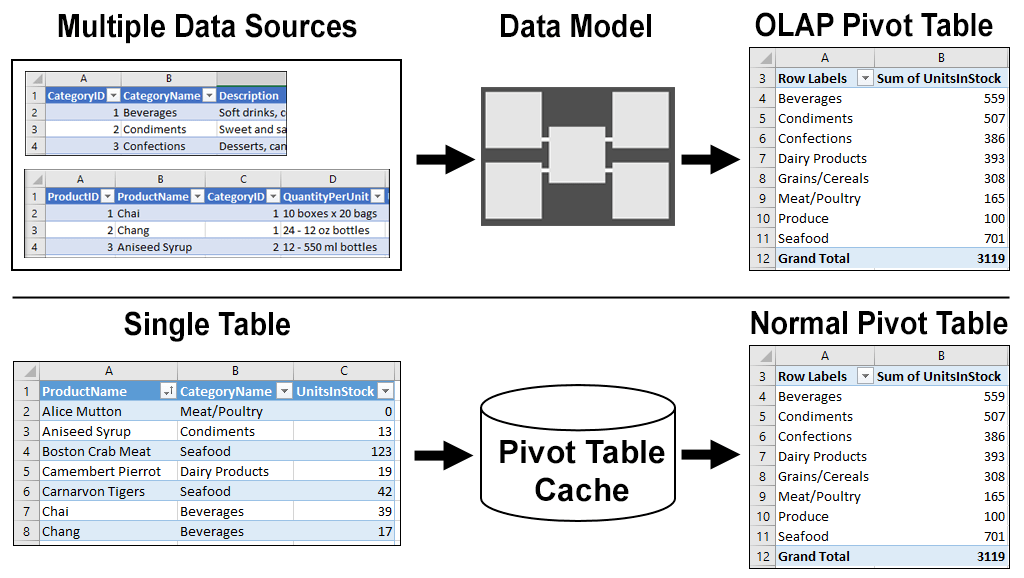
This article explains the difference between a regular Excel pivot table and the new OLAP pivot table used by Power Pivot.

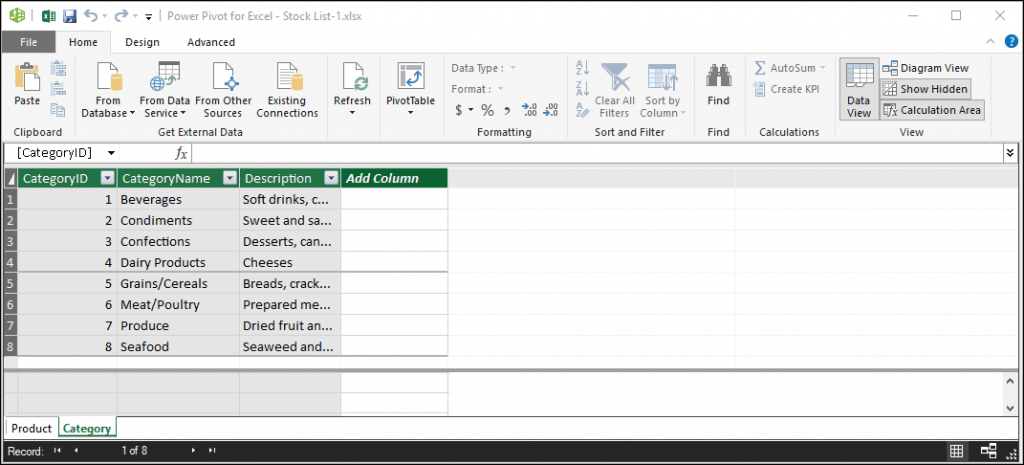
Excel Power Pivot window
This lesson discusses the Power Pivot window and how it differs from the regular Excel window. A sample file is included.
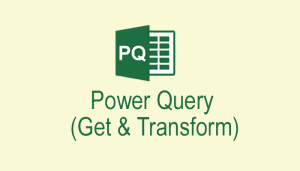
Excel Get & Transform overview
Get & Transform (or Power Query) is an advanced ETL tool. ETL is an acronym for Extract, Transform and Load. This article simply explains this amazing tool.
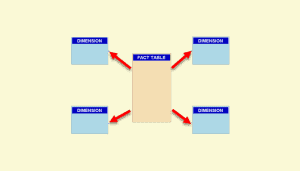
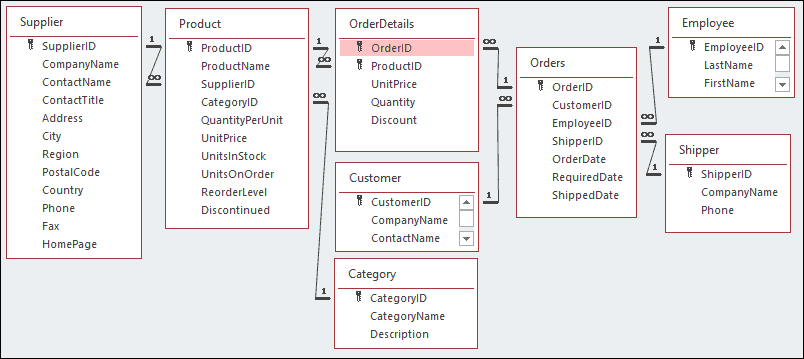
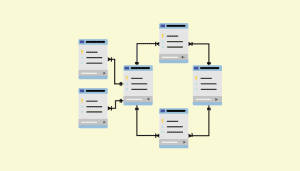
Excel data model Design
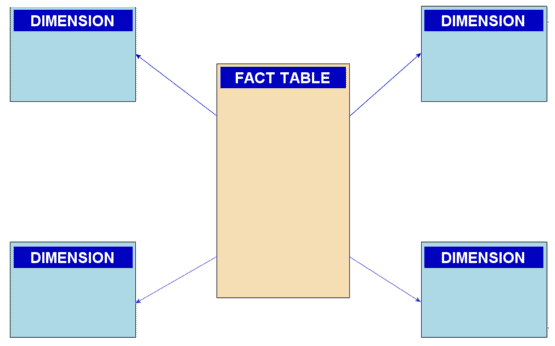
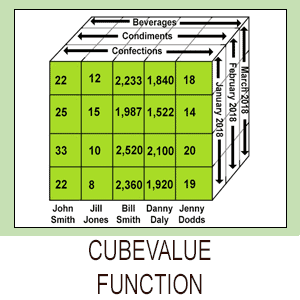
A Power Pivot data model is an OLAP database. OLAP databases can be modeled as a Snowflake or Star schema. This article explains both designs.
Understand OLTP database design
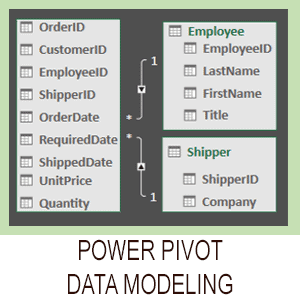
A Power Pivot data model is an OLAP database. Business databases are OLTP databases. This article discusses how OLTP databases are structured.
2 Responses
Good, simple breakdown. And, it’s difficult to find good explanations of power pivot in the “mine of misinformation” lol
This is a good introduction. Thanks.