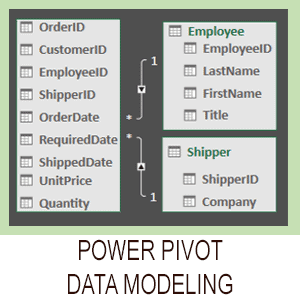
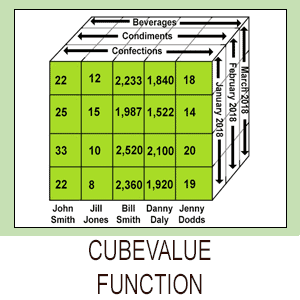
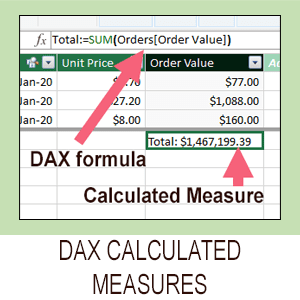
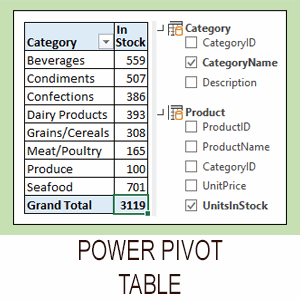
Excel tutorials

The only Excel books you will ever need

  • The only constantly updated Excel 365 titles more…
  • Thoroughly covers Power Pivot and Power Query more…
  • Covers business intelligence and OLAP features more…
  • Simple, easy, understandable, 2-page lessons more…
  • Available as both printed books and e-Books more…
  • Used by schools, colleges and universities  more…
  • Available for 365, 2021, 2019, 2016 and Mac versions more…

Excel Get & Transform overview

Excel Get & Transform is a re-branding of Power Query one of the three “power” tools now included in all current Excel versions.  

Get & Transform’s main role is to prepare data tables for Power Pivot, enabling Power Pivot to create a data model from them.  If you are interested in this aspect of Get & Transform I recommend that you read my Excel Power Pivot 2-minute overview article first.  That puts the whole subject of how Get & Transform  and Power Pivot work together into context.

Even if you have no wish to use Power Pivot, Get & Transform is also very useful when importing external data into regular Excel workbooks.

This article is an unedited lesson from one of the 35 short focused lessons in my Excel Expert Skills book/e-book that seek to empower Excel users with a complete mastery of the Get & Transform tool.

Leave me a comment if you find the article useful.

note

Confusing terminology

In the world of IT, we are very fond of terminology.

The process that I describe as Data Transformation is often referred to using the following alternative terminology:

  • Data Wrangling
  • Data Cleansing
  • Data Scrubbing
  • Data Shaping
  • Data Pre-Processing
  • Data Munging

In this session I will exclusively use the term Data Transformation.  

You can, of course, use the above terminology liberally in meetings.  This will make you sound very important and help to confuse your co-workers.

Personally, I’d rather be referred to as a transformer than a munger, scrubber or wrangler.

Lesson11-1 Understand Excel Get & Transform and ETL

Excel Get & Transform is an advanced ETL tool.  ETL is an acronym for Extract, Transform and Load.

Before Get & Transform was added to Excel, users had to import data into a worksheet and then transform the data inside Excel.  The new Get & Transform tool enables you to import data (from one or more external sources) and then transform it before it is loaded into Excel (or a data model).  This provides many advantages.

The diagram below should make it clear what is meant by the terms Extract, Transform and Load.

Click on the image above to see it more clearly

The ETL methodology

Extract: Most data that is analyzed with Excel doesn’t start its life in an Excel workbook but is imported from an external data source (often from a database or CSV file).  Extract simply means moving this data from the external data source into the Get & Transform tool.

Transform: Extracted data often isn’t in a form that can be easily analyzed by Excel.  There may be unwanted columns, badly named fields, badly formatted fields or corrupted data.  The Get & Transform tool includes a vast array of features that enable you to clean your data before loading it into an Excel table or Pivot Table.  This cleaning process is called Data Transformation (see sidebar).

Load: This simply means exporting the transformed data from the Get & Transform tool to its destination.  A Get & Transform query can export (load) transformed data into an Excel table or into an Excel Pivot Table.

Get & Transform can also load data into a special construct called a Data Model. Data Modeling will be covered later, in: Session Twelve: Power Pivot, Data Modeling, OLAP and Business Intelligence.

Why is ETL better than ELT?

When you add and delete columns, change column headers, re-format columns and add calculated columns to Excel tables you are transforming your data.  Excel users that do not understand how to use the Get & Transform tool use an ELT methodology (Extract from data source, Load into Excel and Transform within Excel).  

Here are some of the advantages in using Get & Transform to implement an ETL methodology:

  • Re-usable and sharable queries: The Get & Transform tool generates a re-usable Query. This means that all of the Get & Transform actions that you define can be repeated to refresh the data in a table on your worksheet with a single click.  You’ll learn more about queries later, in: Lesson 11‑3: Understand queries and connections.
  • Automatically refreshed data: You can configure a query to automatically refresh an Excel table at a timed interval. You’ll learn how to automatically refresh data later, in: Lesson 11‑3: Understand queries and connections.
  • The ability to transform big data: Get & Transform does not share Excel’s limits (of approximately a million rows of data) so it can be used to transform big data (sending the result directly to the data model, 3D Map, or to an Excel worksheet after aggregation). You’ll learn more about pre-aggregating data later, in: Lesson 11‑18: Create an aggregated data query.
  • Better tools: Get & Transform has some advanced transformation tools that are not found in the standard Excel product (for example, the Unpivot Columns tool that you’ll learn about in: Lesson 11‑19: Unpivot aggregated data).
  • The ability to combine data: Get & Transform enables you to merge queries. This enables you to combine relational data from disparate data sources to create a de-normalized data extract.  You’ll learn about this later, in: Lesson 11‑31: Understand normal and de-normalized data.

This lesson is excerpted from the above book. 

This is the only up-to-date Excel book currently published and includes an entire session devoted to the new Dynamic Arrays features.

It is also the only book that will teach you absolutely every Excel skill including Power Pivot, OLAP and DAX.

Covered in Session 12 – Power Pivot, Data Modelling, OLAP and Business Intelligence

Covered in Lesson 12-20: Use the CUBEVALUE function to query a data model.

Covered in Session 13: An Introduction to DAX

Covered in Lesson 12-6: Use an OLAP pivot table to analysze data residing in a data model.

Covered in Lesson 11-33 Create a merged query using fuzzy logic.

Covered in Session 10: 3D Maps.

Covered in Lesson 11-7: Create and use a custom data type.

Covered in Lesson 9-2: Use Natural Language Queries.

Covered in Lesson 11-8: Use custom data types in formulas.

Covered in Lesson 9-1: Use automatic data analysis to create data insights.

Related Articles

Understand modern data analysis

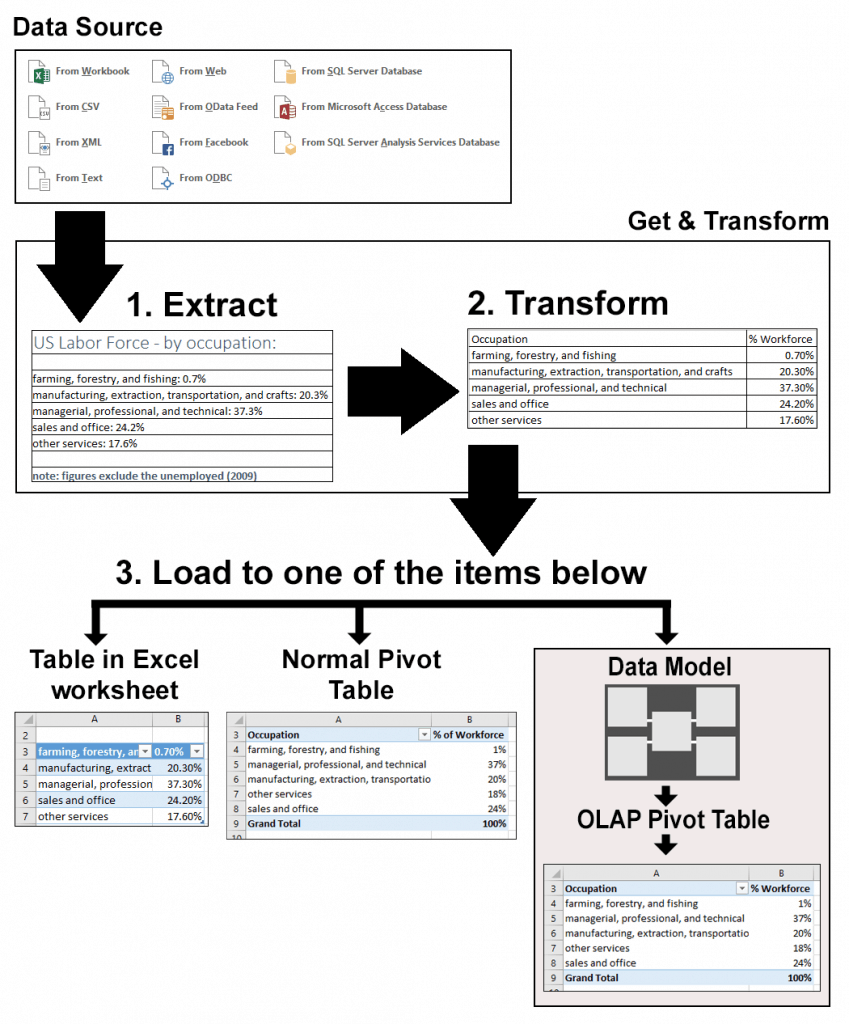
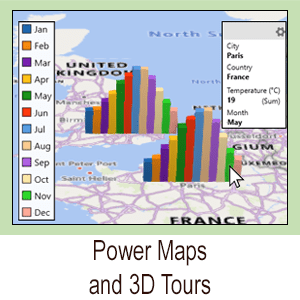
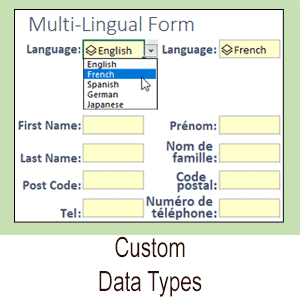
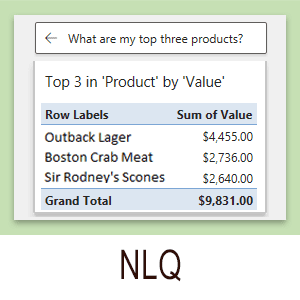
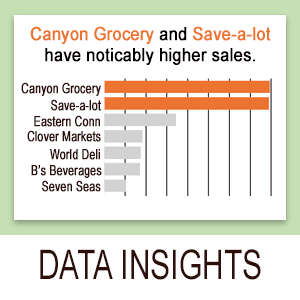
Excel modern data analysis

This article describes a new way of working with Excel called “modern data analysis” enabled by the new Get & Transform and Power Pivot tools.
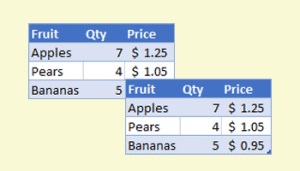
Share this article

Leave a Reply

Your email address will not be published. Required fields are marked *

Which tutorial do you need?