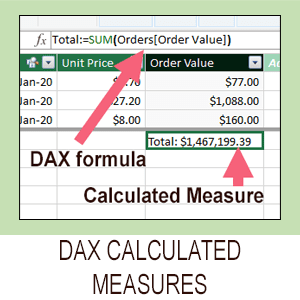
Excel tutorials

The only Excel books you will ever need

  • The only constantly updated Excel 365 titles more…
  • Thoroughly covers Power Pivot and Power Query more…
  • Covers business intelligence and OLAP features more…
  • Simple, easy, understandable, 2-page lessons more…
  • Available as both printed books and e-Books more…
  • Used by schools, colleges and universities  more…
  • Available for 365, 2021, 2019, 2016 and Mac versions more…

Excel modern data analysis

The term Modern Data Analysis is often used to describe a new and better way of analyzing data that only became possible with the release of Excel 2019.

Excel 2019 and Excel 365 users can now harness a powerful technology technology called OLAP (OnLine Analytical Processing). OLAP is sometimes also referred to as Business Intelligence but you’ll find out a lot more about how this can be used in the article below.

Most Excel users will be able to broadly understand the article but to actually use modern data analysis you do need a lot of background knowledge.  You may prefer to begin with my Excel Power Pivot 2-minute overview article first.  That puts the whole subject of OLAP into context.

This article is an unedited lesson from one of the 68 short focused lessons in my Excel Expert Skills book/e-book. 

Leave me a comment if you find the article useful.

note

Modern data analysis supports Big Data

One of the compelling reasons to move to modern data analysis is the increasing requirement to work with Big Data.

Excel worksheets theoretically support a little over a million rows of data (in reality the useful limit is far lower).

Power Pivot tables can contain up to approximately two thousand million rows, meaning that there is no imaginable data requirement that cannot be supported.

note

Modern data analysis is fast

Even when working with data tables containing many millions of rows most analysis actions will complete almost instantly.

Power Pivot uses Microsoft’s xVelocity in-memory analysis engine. This engine can scan billions of data rows per second and can produce reports in a tiny fraction of the time that would be needed by Excel.

note

Modern data analysis performs most of the work outside Excel

Notice that, in modern data analysis, only Step 5 involves using Excel.

All of the actions that are used to create the data model are performed by the Get & Transform and Power Pivot applications.

Lesson 12-8: Understand modern data analysis

You now have an in-depth understanding of Get & Transform. You also have a limited understanding of relational database theory and Power Pivot. With this foundation knowledge you should now be able to understand how these tools and technologies work together to provide a new paradigm for data analysis using Excel that is often described as: Modern Data Analysis.

What does modern data analysis mean?

When the Get & Transform and Power Pivot tools were added to Excel (in the Excel 2019 perpetual licence version and the January 2019 Excel 365 semi-annual update) they enabled a new paradigm for data analysis.
The term: Modern Data Analysis is often used to describe the use of these new tools in their intended fashion. The term: Classic Data Analysis has been used to describe the “old way” of doing things.

The five steps in the modern data analysis workflow

Most data analysis tasks require five clearly defined steps: Get, Transform, Relate, Aggregate (summarize) and Visualize.

  1. Get the data. This means importing data (that may be located in a database, Excel worksheet, CSV file or other source).
  2. Transform the data. This might include removing unwanted columns, converting text fields to dates, rounding numeric values, filtering, sorting, renaming columns, adding calculated columns and other similar tasks.
  3. Relate the data. If data resides in several different tables, there needs to be a method to either define the relationships between them or to consolidate the data into a single table.
  4. Aggregate (summarize) the data. Values usually need to be aggregated (for example by creating grouped totals or averages) into a digestible form.
  5. Visualize the data. This may involve adding charts, pivot charts, conditional formatting, sparklines and other visualizations.

How data analysis was done in the past (classic data analysis)

  1. Get the data. This was traditionally done by importing data into a collection of Excel tables or ranges.
  2. Transform the data. This might include removing unwanted columns from the worksheet, adding new calculated columns containing Excel functions and formulas, converting text fields to dates, rounding numeric values, renaming columns, formatting cells and other similar tasks.
  3. Relate the data. Traditional (non OLAP) pivot tables can only summarize data from a single table so data from several different tables would often have to be consolidated into a single table. This was traditionally done with VLOOKUP, SWITCH, INDEX, MATCH, IF and IFS functions.
  4. Aggregate the data. Excel contains many methods to summarize data. Popular methods include Automatic Subtotals, Data Tables, traditional (as opposed to OLAP) Pivot Tables and aggregation functions such as SUM, SUMIFS, AVERAGE, MAX, MIN, COUNT and COUNTIF.
  5. Visualize the data. This might involve summarizing data in a traditional pivot table or pivot chart, adding charts, conditional formatting, sparklines and other visualizations.

How modern data analysis achieves faster and better results

Add Your Heading Text Here

  1. Get the data. This is done using the Get and Transform tool. Data can be imported from a huge range of data sources using this tool (including relational databases, Excel worksheets, CSV files and web pages). Get & Transform can work with very large data sets (often called Big Data) as it is not restricted to Excel’s million row limitation (see sidebar).
  2. Transform the data. This is also done using the Get and Transform tool. Unlike Excel, the transform actions are stored in PQFL (Power Query Formula Language) expressions. Both the connection details and the PQFL steps are stored in a query. This means that the query can be re-run, avoiding repetitive work in the future if the source data changes.
  3. Relate the data. Power Pivot enables tables to be related in a data model using primary key/foreign key relationships. This provides huge flexibility and avoids the use of any Excel functions (such as VLOOKUP) to relate data.
  4. Summarize the data. While a traditional pivot table can only access data residing in a single table, data models can be analyzed with a new type of pivot table (called an OLAP pivot table). The OLAP pivot table can do just about anything that a regular pivot table can do but can access data residing in multiple related tables.

    Power Pivot also enables DAX (Data Analysis Expressions) to be added to the data model. DAX enables calculated columns and calculated measures (aggregations) to be simply defined. You’ll learn about DAX later, in: Session Thirteen: An introduction to DAX.

  5. Visualize the data. OLAP Pivot Tables and OLAP Pivot Charts provide the primary method of visualizing data residing in data models. It is also possible to use any of Excel’s classic analysis and visualization features by using CUBEVALUE functions to extract data directly from a data model into Excel cells. You’ll learn more about the CUBEVALUE function later, in: Lesson 12 20: Use the CUBEVALUE function to query a data model.

This lesson is excerpted from the above book. 

This is the only up-to-date Excel book currently published and includes an entire session devoted to the new Dynamic Arrays features.

It is also the only book that will teach you absolutely every Excel skill including Power Pivot, OLAP and DAX.

Covered in Session 12 – Power Pivot, Data Modelling, OLAP and Business Intelligence

Covered in Lesson 12-20: Use the CUBEVALUE function to query a data model.

Covered in Session 13: An Introduction to DAX

Covered in Lesson 12-6: Use an OLAP pivot table to analysze data residing in a data model.

Covered in Lesson 11-33 Create a merged query using fuzzy logic.

Covered in Session 10: 3D Maps.

Covered in Lesson 11-7: Create and use a custom data type.

Covered in Lesson 9-2: Use Natural Language Queries.

Covered in Lesson 11-8: Use custom data types in formulas.

Covered in Lesson 9-1: Use automatic data analysis to create data insights.

Related Articles

Understand OLAP Pivot Tables

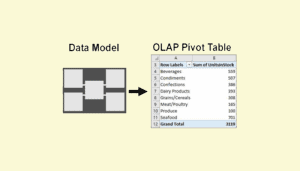
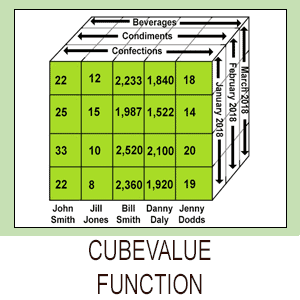
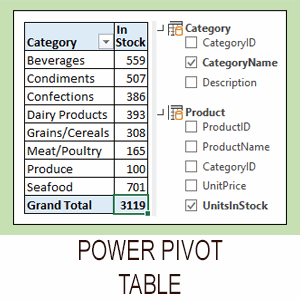
Excel OLAP pivot tables

This article explains the difference between a regular Excel pivot table and the new OLAP pivot table used by Power Pivot.

Understand the Power Pivot window

Excel Power Pivot window

This lesson discusses the Power Pivot window and how it differs from the regular Excel window. A sample file is included.

Understand Get & Transform and ETL

Excel Get & Transform overview

Get & Transform (or Power Query) is an advanced ETL tool. ETL is an acronym for Extract, Transform and Load. This article simply explains this amazing tool.

OLAP Star Schema

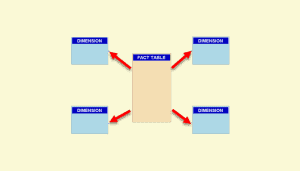
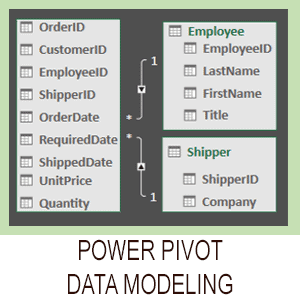
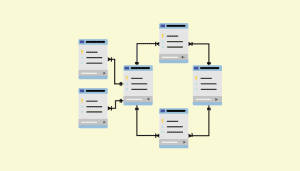
Excel data model Design

A Power Pivot data model is an OLAP database. OLAP databases can be modeled as a Snowflake or Star schema. This article explains both designs.

OLTP database example

Understand OLTP database design

A Power Pivot data model is an OLAP database. Business databases are OLTP databases. This article discusses how OLTP databases are structured.

Share this article

Leave a Reply

Your email address will not be published. Required fields are marked *

Cross-lesson hyperlinks

In order to use all cross-lesson hyperlinks you will need to download the full e-book. The Expert Skills e-book contains 253 short lessons that will teach you everything there is to know about Excel.

When you download the e-book you’ll be able to access every lesson,  online or offline, on all of your devices, using Amazon’s free advanced e-book reader

Which tutorial do you need?