
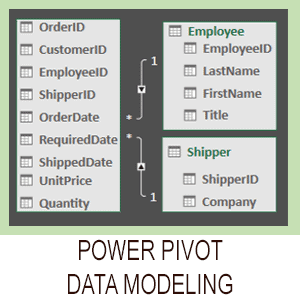

Excel Power Pivot – 2 minute overview
Power Pivot causes great confusion. This simple 2-minute overview completely de-mystifies Power Pivot and its associated technologies.

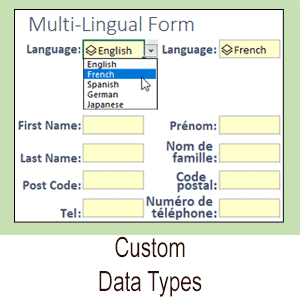
Excel modern data analysis
This article describes a new way of working with Excel called “modern data analysis” enabled by the new Get & Transform and Power Pivot tools.
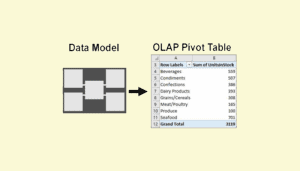
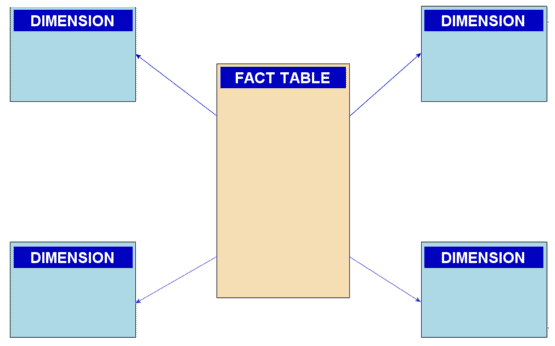
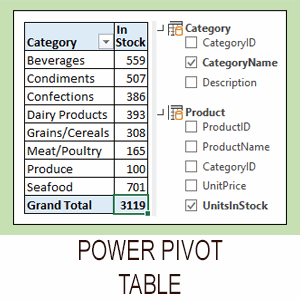
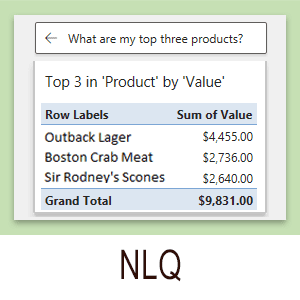
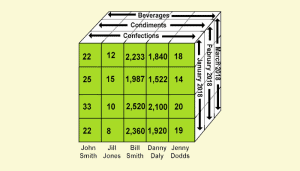
Excel OLAP pivot tables
This article explains the difference between a regular Excel pivot table and the new OLAP pivot table used by Power Pivot.

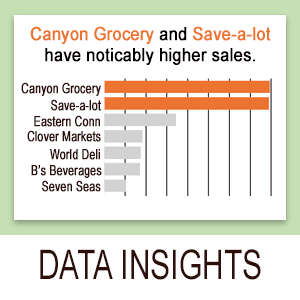
Excel Power Pivot window
This lesson discusses the Power Pivot window and how it differs from the regular Excel window. A sample file is included.
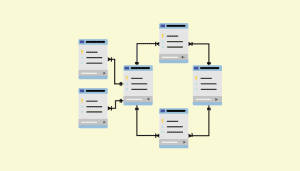
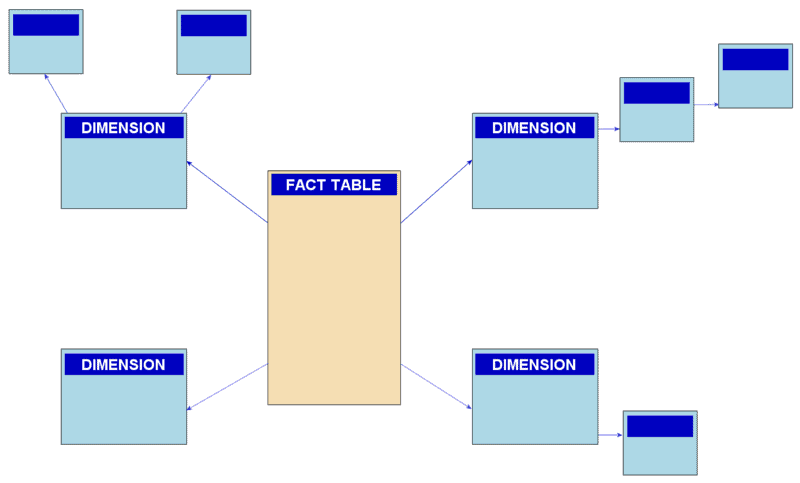
Understand OLTP database design
A Power Pivot data model is an OLAP database. Business databases are OLTP databases. This article discusses how OLTP databases are structured.
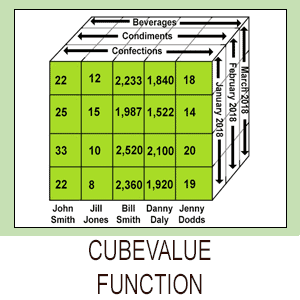
Excel CUBEVALUE function
This lesson shows how to use the CUBEVALUE function to make an OLAP pivot table directly access the data model. Includes sample file.