Excel tutorials

The only Excel books you will ever need

  • The only constantly updated Excel 365 titles more…
  • Thoroughly covers Power Pivot and Power Query more…
  • Covers business intelligence and OLAP features more…
  • Simple, easy, understandable, 2-page lessons more…
  • Available as both printed books and e-Books more…
  • Used by schools, colleges and universities  more…
  • Available for 365, 2021, 2019, 2016 and Mac versions more…

Excel 3D Maps is a re-name of an older tool called Power Maps.  3D Maps allows you to create sophisticated geographical visualizations from data residing in an Excel data model.

An Excel data model is a type of OLAP database.  If you have no understanding of OLAP I recommend that you begin with my Excel Power Pivot 2-minute overview article first.  That puts the whole subject of OLAP, Power Pivot and Excel 3D Maps into context and then the lesson below will make a lot more sense. 

The article below is an unedited lesson from one of the 14 short focused lessons in my Excel Expert Skills book/e-book that enables students to master the Excel 3D Maps tool tool.  The Excel 3D Maps tool is now included in all current Excel versions.

Leave me a comment if you find the article useful.

Lesson 10 1: Understand how Excel 3D Maps use the data model

The self-service BI Suite

Since 2010, some versions of Excel (those aimed at enterprise users) were able to install Microsoft’s “Power” suite of Business Intelligence (BI) tools.

Collectively they are often referred to as the Self-Service BI suite.

The suite comprised of four components:

  • Power Pivot
  • Power Query
  • Power Maps
  • Power View

Two of these products (Power Pivot and Power Query) were tools that could only be used by specialized IT staff (with extensive data modeling skills) to create data models.  

The other two (Power View and Power Maps) were simple easy-to-learn tools that created visualizations of data within a data model.  Excel users could also use a data model as the source data for a pivot table.

The vision behind self-service BI was that Excel users with no specialized data modeling skills could make use of the data models created by their IT department to create sophisticated visualizations and reports faster and more easily than was possible with Excel alone.

Excel 3D Maps can used data in a data model
Click on the image above to see it more clearly

In 2013 the Power Query tool was added to Excel and re-named Get & Transform.  You’ll learn how to use Get & Transform later, in: Session Eleven: Create Get & Transform queries.

In 2016 Power Maps was added to Excel and re-named Excel 3D Maps.  This is the tool that you will learn in this session.

In 2019 Power Pivot was added to Excel.  You’ll learn how to use Power Pivot later, in: Session Twelve: Power Pivot, Data Modeling, OLAP and Business Intelligence and Session Thirteen: An introduction to DAX.

Power View no longer exists as a self-contained product (or add-in) and cannot be added to current versions of Excel.  Instead, Power View has evolved into one component of a new desktop and cloud application called Power BI.

You can learn and use Excel 3D Maps without learning data modeling

The data modeling skills that are taught in: Session Twelve: Power Pivot, Data Modeling, OLAP and Business Intelligence are very challenging to master.

In recognition of this the 3D Maps feature has been designed so that users with no data modeling skills can use 3D Maps by using a single Excel table (or range) as a data source. 

Behind the scenes, 3D Maps automatically converts the table (or range) into a one-table data model.  The 3D Maps tool then uses this data model as source data.

If you later create advanced data models everything in this session is equally relevant

Data modeling is a very challenging subject that many Excel users may decide not to invest time learning.

If you decide to progress to: Session Twelve: Power Pivot, Data Modeling, OLAP and Business Intelligence  and Session Thirteen: An introduction to DAX, you will learn some very advanced data modeling skills. 

While well-designed data models are very difficult to create, they are amazingly easy to use.  All of the skills you will learn in this session will work in exactly the same way when powered by a hand-crafted multi-dimensional data model.

3D Maps can cause “out of memory” errors

3D Maps needs to hold a data model (that is a duplication of the source data) in your computer’s memory. 

Data models can require a lot of memory (depending upon the size of the source data).

If you encounter crashes or out-of-memory error warnings while working through this session you will need to consult: Lesson 12‑1: Understand data model memory requirementsThis lesson explains the memory issue (and how to solve this problem) in depth. 

This lesson is excerpted from the above book. 

This is the only up-to-date Excel book currently published and includes an entire session devoted to the new Dynamic Arrays features.

It is also the only book that will teach you absolutely every Excel skill including Power Pivot, OLAP and DAX.

Covered in Session 12 – Power Pivot, Data Modelling, OLAP and Business Intelligence

Covered in Lesson 12-20: Use the CUBEVALUE function to query a data model.

Covered in Session 13: An Introduction to DAX

Covered in Lesson 12-6: Use an OLAP pivot table to analysze data residing in a data model.

Covered in Lesson 11-33 Create a merged query using fuzzy logic.

Covered in Session 10: 3D Maps.

Covered in Lesson 11-7: Create and use a custom data type.

Covered in Lesson 9-2: Use Natural Language Queries.

Covered in Lesson 11-8: Use custom data types in formulas.

Covered in Lesson 9-1: Use automatic data analysis to create data insights.

Related Articles

Understand modern data analysis

Excel modern data analysis

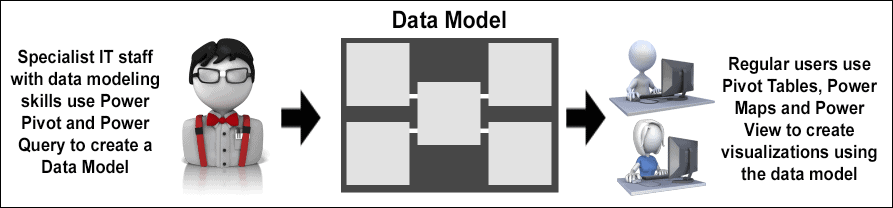
This article describes a new way of working with Excel called “modern data analysis” enabled by the new Get & Transform and Power Pivot tools.

Understand OLAP Pivot Tables

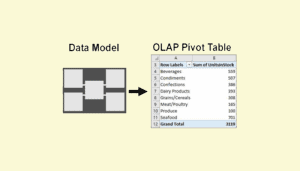
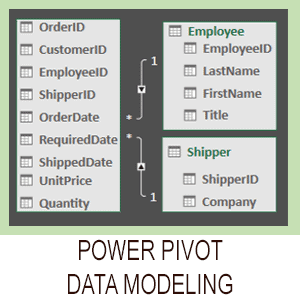
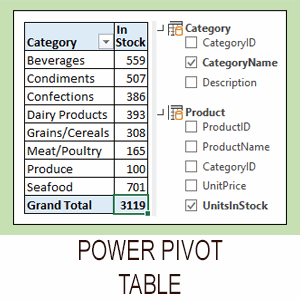
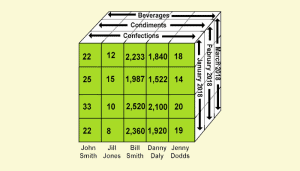
Excel OLAP pivot tables

This article explains the difference between a regular Excel pivot table and the new OLAP pivot table used by Power Pivot.

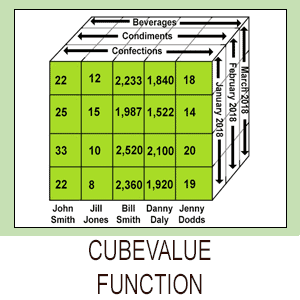
Excel CUBEVALUE function

This lesson shows how to use the CUBEVALUE function to make an OLAP pivot table directly access the data model. Includes sample file.

Share this article

Leave a Reply

Your email address will not be published. Required fields are marked *

Which tutorial do you need?