Excel tutorials

The only Excel books you will ever need

  • The only constantly updated Excel 365 titles more…
  • Thoroughly covers Power Pivot and Power Query more…
  • Covers business intelligence and OLAP features more…
  • Simple, easy, understandable, 2-page lessons more…
  • Available as both printed books and e-Books more…
  • Used by schools, colleges and universities  more…
  • Available for 365, 2021, 2019, 2016 and Mac versions more…

Excel Power Pivot window

This article walks you around the Excel Power Pivot window and gives an overview of how it differs from the Excel window.  The full Power Pivot add in was added to all Excel versions in 2019.  Power Pivot caused great confusion amongst Excel users.  Many users didn’t even understand what it did.  The name suggested that it might be some sort of new pivot table with extra features.  To understand what it really is you need to first understand OLAP.

If you have no understanding of OLAP I recommend that you begin with my Excel Power Pivot 2-minute overview article first.  That puts the whole subject of OLAP into context and will make the lesson below make a lot more sense.

The article below is an unedited lesson from one of the 68 short focused lessons in my Excel Expert Skills book/e-book that seeks to empower any Excel user with a complete mastery of OLAP skills. 

Leave me a comment if you find the article useful.

note

You can paste data directly into a new data model table

To do this:

1. Select and copy the range of data that you want to import into a new Power Pivot table.

2. Open the Power Pivot window.

3. Click: Home->Clipboard->
Paste (from within the Power Pivot window).

4. Provide a name for the new table when prompted.

note

If data in the workbook changes the data model will not automatically update

The data you are looking at is an independent copy of the data residing in the Excel Product and Category tables.

If the data in the Product and Category tables changes, you will not see any change in the data model (unless you refresh the model from the original source data).

important

Do not import or transform data using Power Pivot

The Power Pivot application is a tool to construct and refine data models.

Power Pivot is not a good tool for importing data into the data model. 

You should always import data into the data model using Get & Transform (in the way you did for this model in: Lesson 12‑3: Add tables to a data model).

Using Get & Transform provides powerful data transformation features that enable you to edit and refine your data in the future.

The best-practice rule:

Do not use Power Pivot to import or transform data.

… is included in: Appendix A: Power Pivot Rules.

Lesson 12-4: Understand the Power Pivot window

1. Open the sample file Stock List-2 in Excel.

2. Open the Excel Power Pivot window.

Click: Power Pivot->Data Model->Manage.

The Power Pivot window opens.

Excel Power Pivot window
Click on the image above to see it more clearly

This is your first view of the Power Pivot application.

The differences between the Excel Power Pivot window and Excel

The Power Pivot window seems very similar to Excel but you are really looking at a completely different application that has been engineered to “look and feel” like Excel. This is intended to make you feel instantly at home with Power Pivot. 

You can see that there is a data grid that is similar to Excel with rows and columns. You can also see tabs showing that there are two tables in the above data model (very similar to two worksheets in a workbook).

Just like Excel, you can:

  • Rename and delete columns.
  • Change column widths.
  • Insert new columns.
  • Click and drag columns to new locations.
  • Rename and delete sheet tabs.
  • Click and drag sheet tabs to re-arrange them.
  • Use AutoSum to aggregate all of the values in a column.
    This creates a calculated measure. You’ll learn how to use calculated measures later in: Lesson 13 3: Create a DAX calculated measure.
  • Format cells.
  • Sort columns.

Unlike Excel you can't:

  • Type a value into a cell or change any of the information you see displayed (although you can refresh the data from the original data source).
  • Have more than one table in a sheet. A Power Pivot sheet contains a single table rather than a worksheet. 
  • Refer to a cell using A1 notation (A1 notation means cell references such as B12 or A1:C14). Power Pivot does not recognize letters to identify columns.  Columns must be referred to by name.
  • Assign different data types within a column. You cannot, for example, have text in some cells and numbers in other cells in the same column.  You learned about data types in: Lesson 11‑6: Understand data types.
  • Have more than one formula in a column. When a formula is added to a Power Pivot column it always applies to every cell in that column.  You’ll learn more about calculated columns later, in: Lesson 13‑2: Add a DAX calculated column.

Some things Power Pivot can do that Excel cannot

  • Create relationships between tables.
  • Assign a larger range of data types to columns.
  • Use DAX functions (you’ll learn about DAX later, in: Session Thirteen: An introduction to DAX).
  • Create calculated measures. You’ll learn more about measures later, in: Lesson 13 3: Create a DAX calculated measure.
  • Work with Big Data. An Excel worksheet can contain a maximum of just over a million rows. A Power Pivot table can contain a maximum of just over a thousand million rows.
  • Produce extremely fast (often perceived as instant) results even when analyzing data sets containing many millions of rows. Power Pivot uses Microsoft’s xVelocity in-memory analysis engine. This engine can scan billions of data rows per second and can produce reports in a tiny fraction of the time needed by Excel.

3. Close the Excel Power Pivot window.

4. Close Excel without saving the workbook.

This lesson is excerpted from the above book. 

This is the only up-to-date Excel book currently published and includes an entire session devoted to the new Dynamic Arrays features.

It is also the only book that will teach you absolutely every Excel skill including Power Pivot, OLAP and DAX.

Covered in Session 12 – Power Pivot, Data Modelling, OLAP and Business Intelligence

Covered in Lesson 12-20: Use the CUBEVALUE function to query a data model.

Covered in Session 13: An Introduction to DAX

Covered in Lesson 12-6: Use an OLAP pivot table to analysze data residing in a data model.

Covered in Lesson 11-33 Create a merged query using fuzzy logic.

Covered in Session 10: 3D Maps.

Covered in Lesson 11-7: Create and use a custom data type.

Covered in Lesson 9-2: Use Natural Language Queries.

Covered in Lesson 11-8: Use custom data types in formulas.

Covered in Lesson 9-1: Use automatic data analysis to create data insights.

Related Articles

Understand modern data analysis

Excel modern data analysis

This article describes a new way of working with Excel called “modern data analysis” enabled by the new Get & Transform and Power Pivot tools.

Understand OLAP Pivot Tables

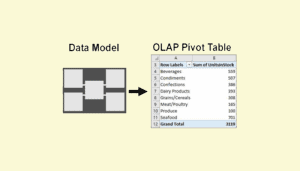
Excel OLAP pivot tables

This article explains the difference between a regular Excel pivot table and the new OLAP pivot table used by Power Pivot.

OLAP Star Schema

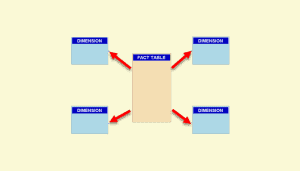
Excel data model Design

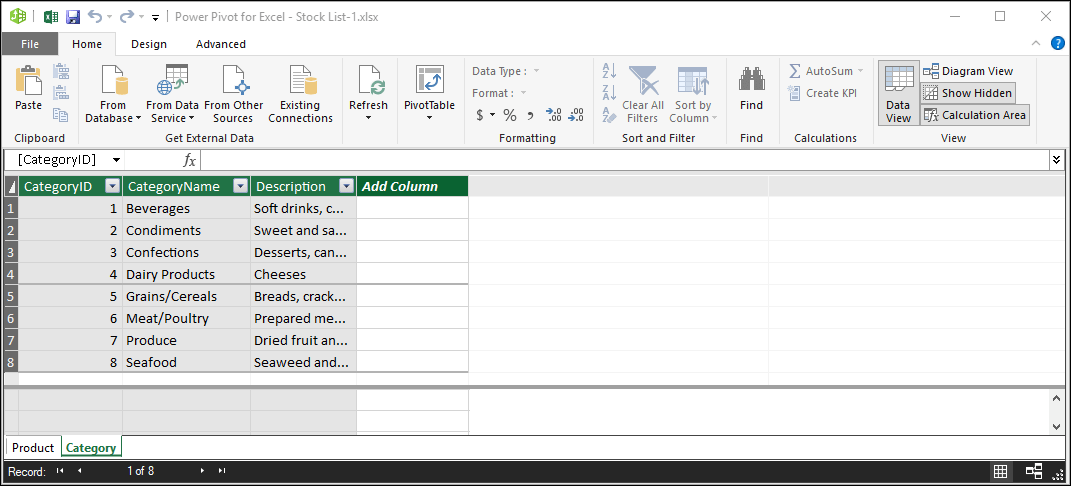
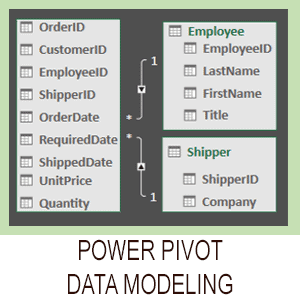
A Power Pivot data model is an OLAP database. OLAP databases can be modeled as a Snowflake or Star schema. This article explains both designs.

OLTP database example

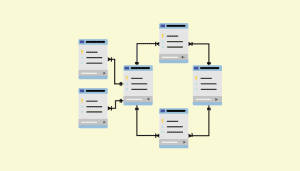
Understand OLTP database design

A Power Pivot data model is an OLAP database. Business databases are OLTP databases. This article discusses how OLTP databases are structured.

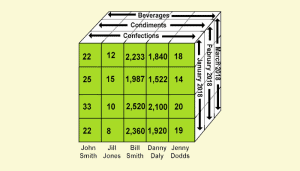
Excel CUBEVALUE function

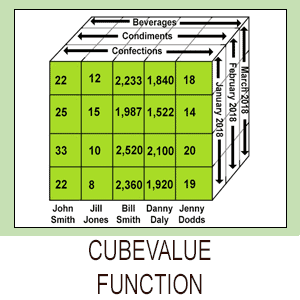
This lesson shows how to use the CUBEVALUE function to make an OLAP pivot table directly access the data model. Includes sample file.

Share this article

Leave a Reply

Your email address will not be published. Required fields are marked *

Which tutorial do you need?