Excel OLAP pivot tables are a relatively new. Most advanced Excel users are familiar with Pivot Tables but do not realize that Excel now has a new and more powerful type of Pivot Table. You’ll find out a lot more about the difference between the different Pivot Table types in the article below.
Most Excel users will be able to broadly understand the article but to actually use OLAP pivot tables requires a lot of background knowledge. You may prefer to begin with my Excel Power Pivot 2-minute overview article first. That puts the whole subject of OLAP into context.
This article is an unedited lesson from one of the 68 short focused lessons in my Excel Expert Skills book/e-book that seek to empower Excel users with a mastery of OLAP skills.
Leave me a comment if you find the article useful.
- Excel 365
- Excel 2019
- Excel 2016
- Last Updated: September 20, 2020
note
What is self-service BI?
In the recent past it was very expensive to implement a Business Intelligence solution using server-based products such as Microsoft SQL Server Analysis Services.
BI projects would often take many months to complete and involve large numbers of highly trained IT professionals to design (and extract and transform data into) an OLAP cube. An OLAP cube is the earliest implementation of an OLAP database – for more on this see: Lesson 12‑11: Understand OLTP database design (sidebar).
The vision for the Excel data model is that ordinary Excel users can instantly and automatically create a ready-to-go data model (OLAP database).
An OLAP pivot table or OLAP pivot chart can then be used to analyze and present the contents of the data model.
Microsoft sometimes call this concept: Self Service BI.
Lesson 12-7: Understand Excel OLAP pivot tables
In: Lesson 9‑4: Understand the pivot table data cache you learned that a normal pivot table does not access the source data directly. Instead, a pivot table data cache is created from the data source. The pivot table then takes its data from the cache.
In: Lesson 11‑30: Load a query directly into the PivotTable cache, you learned that a pivot table data cache doesn’t need to use an Excel worksheet as its data source. It is possible to construct the cache directly from an external data source.
In: Lesson 12‑3: Add tables to a data model, Lesson 12‑5: Add a relationship to a data model using Power Pivot and Lesson 12‑6: Use an OLAP pivot table to analyze data residing in a data model, you created a data model and then used it as the data source for a new type of pivot table called an OLAP pivot table.
You may wonder why a different type of pivot table is needed when you create a pivot table from a data model rather than a single Excel table.
Normal and OLAP Pivot Tables
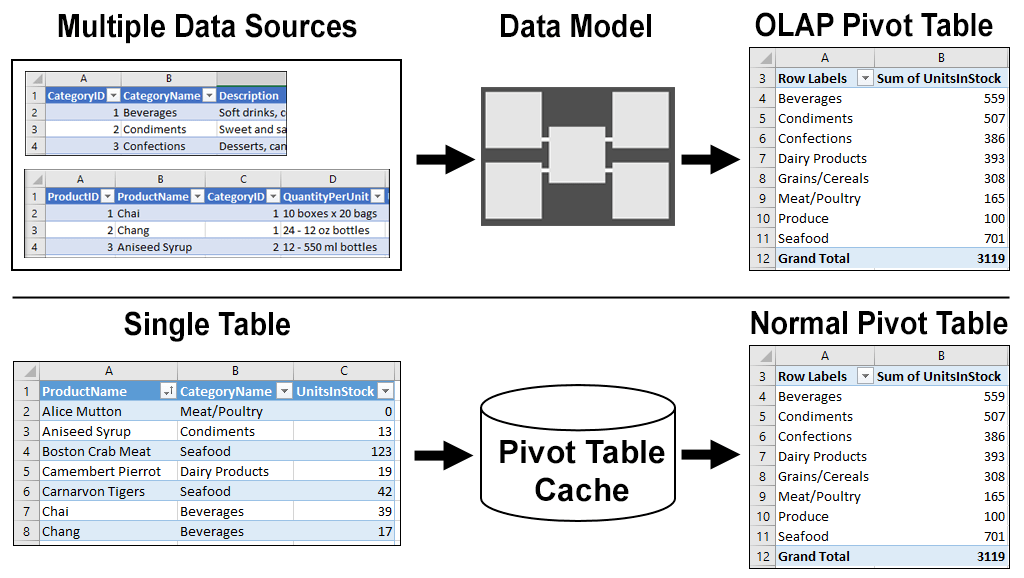
In the above diagram you can see that both the regular pivot table and the OLAP pivot table look identical.
The difference between them is that the OLAP pivot table obtains its data from a Data Model created from one or more related tables. The ability to select fields from more than one related table is one of the biggest advantages of working with OLAP pivot tables.
The regular pivot table obtains its data from a pivot table data cache created from a single table residing in an Excel worksheet or external data source.
Excel OLAP pivot tables are standards-based
The PivotTable data cache can be thought of as a non-standard OLAP implementation that is restricted to a single table data source.
In contrast, when data resides in a data model it can be retrieved directly from the data model using an industry-standard query language called MDX (Multi-Dimensional eXpressions). You’ll learn more about MDX queries later, in: Lesson 12‑19: Understand MDX queries and OLAP pivot table limitations.
MDX is also used by many non-Microsoft products such as Crystal Reports.
An OLAP pivot table automatically generates the MDX queries it needs to return values to display in the OLAP pivot table.
Excel OLAP pivot tables can work with big data
Excel worksheets are limited to approximately one million rows. OLAP pivot tables obtain their data from a Data Model. Data Models can contain about two thousand million data rows.
In: Lesson 11‑30: Load a query directly into the PivotTable cache, you learned how a regular pivot table can work with big data by using Get & Transform to load data (from an external non-Excel data source) directly into the PivotTable Data Cache.
While it is true that a regular pivot table can also overcome the million-row limitation in this way, the PivotTable Data Cache is still restricted to 2.1 thousand million data items (rather than rows) and is unable to work with more than one table.
What is Business Intelligence?
Business Intelligence is a very broad term that was first used in 1865 to describe how the banker Sir Henry Furnese prospered by receiving and acting upon information before his contemporaries.
When IT professionals talk about Business Intelligence (BI) today, they usually mean the analysis and presentation of data sourced from an OLAP database (data model).
Dr E.F. Codd (the inventor of OLAP) wrote a paper in 1985 that proposed 12 rules for defining OLAP. Two of his rules were:
- The tool (and not the user) should be concerned with where the physical data comes from.
- Reporting facilities should present information in any way the user wants to view it.
You can see how Microsoft’s BI solution complies with Codd’s rules by separating the data modeling (difficult) and reporting (easy) tasks and by enabling complete reporting flexibility via the OLAP pivot table.
This lesson is excerpted from the above book.
This is the only up-to-date Excel book currently published and includes an entire session devoted to the new Dynamic Arrays features.
It is also the only book that will teach you absolutely every Excel skill including Power Pivot, OLAP and DAX.
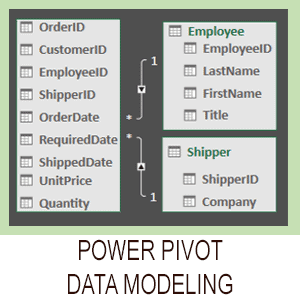
Covered in Session 12 – Power Pivot, Data Modelling, OLAP and Business Intelligence

Covered in Lesson 12-20: Use the CUBEVALUE function to query a data model.
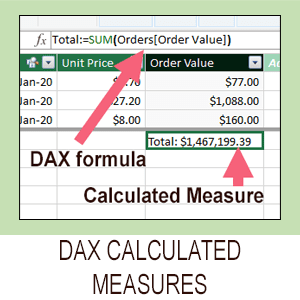
Covered in Session 13: An Introduction to DAX
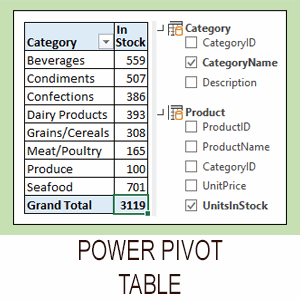
Covered in Lesson 12-6: Use an OLAP pivot table to analysze data residing in a data model.
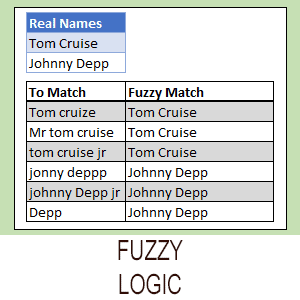
Covered in Lesson 11-33 Create a merged query using fuzzy logic.
Covered in Session 10: 3D Maps.
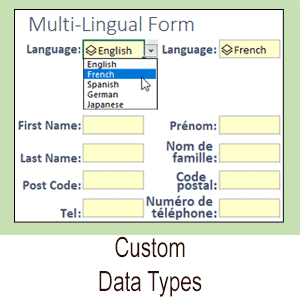
Covered in Lesson 11-7: Create and use a custom data type.
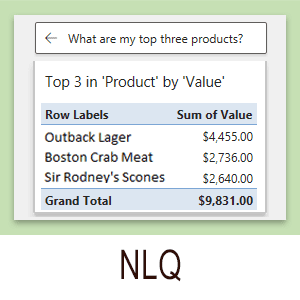
Covered in Lesson 9-2: Use Natural Language Queries.

Covered in Lesson 11-8: Use custom data types in formulas.
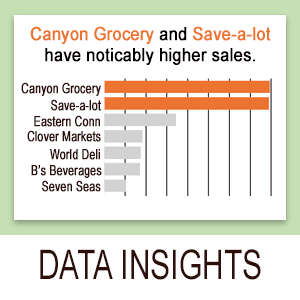
Covered in Lesson 9-1: Use automatic data analysis to create data insights.
Related Articles

Excel Power Pivot – 2 minute overview
Power Pivot causes great confusion. This simple 2-minute overview completely de-mystifies Power Pivot and its associated technologies.

Excel modern data analysis
This article describes a new way of working with Excel called “modern data analysis” enabled by the new Get & Transform and Power Pivot tools.

Excel Power Pivot window
This lesson discusses the Power Pivot window and how it differs from the regular Excel window. A sample file is included.
Excel data model Design
A Power Pivot data model is an OLAP database. OLAP databases can be modeled as a Snowflake or Star schema. This article explains both designs.
Understand OLTP database design
A Power Pivot data model is an OLAP database. Business databases are OLTP databases. This article discusses how OLTP databases are structured.
Excel CUBEVALUE function
This lesson shows how to use the CUBEVALUE function to make an OLAP pivot table directly access the data model. Includes sample file.
