- Excel 365
- Excel 2021
- Excel 2019
- Excel 2016
- February 12, 2022
- 2 Comments

Excel Power Pivot enables a technology called OLAP (OnLine Analytical Processing) to be used by Excel. OLAP is sometimes also referred to as Business Intelligence, but you’ll find out a lot more about what that actually means in the article below.
I’ll introduce this article with a little anecdote.
Many years ago (in the early 90’s) I was contracted to engineer a pan-European business intelligence solution for one of the world’s largest car manufacturers. At that time OLAP was a big new game-changing technology that every blue chip company just had to have.
OLAP was so new that none of the directors really understood what it was but they did appreciate the benefits. I had to travel to many countries to give presentations explaining benefits such as “this report that used to take four hours will print out in a few seconds using OLAP”. But if I was asked to explain how OLAP worked its magic it was very difficult to provide a simple explanation for such a complex technical subject (even to IT personnel).
When I first added OLAP lessons to my Expert Skills book I had to rise to this same challenge once again. Was it really possible to explain the huge number of skills needed to effectively implement OLAP in such a simple way that even non-technical users could learn to create efficient data models? I did this by creating 68 short, bite-sized lessons that absolutely anybody can understand. You’ll find links to many of the lessons in the article below.
The challenge in this article was to distil 68 lessons and 165 pages down to a short 2-minute article. If you read the article carefully, you will understand exactly what OLAP is, how it works, and what it can deliver for you.
Leave me a comment if you find the article useful.
Excel power pivot - 2 minute overview
Excel users are often confused about exactly what Power Pivot does (especially if they have been browsing the Internet which is a mine of misinformation).
I’m often asked by business analysts for a “Quick Overview” of what Excel’s new “power” tools actually do.
Multidimensional analysis using Power Pivot isn’t one of those subjects that is easy to explain in a few words but in this article you’ll discover in just two minutes what Power Pivot is, what it does and why it is useful. If you want to delve a little deeper, you can explore the hyperlinks within the text but I’d recommend that you first just read straight through the article to understand the big picture.
Excel Power Pivot is one of several "power" tools that are now included in Excel
The term “Power Pivot” is often rather confusingly used to refer to several different tools that are used to implement a technology called OLAP (OnLine Analytical Processing). OLAP isn’t new. Microsoft’s first OLAP Server (Microsoft Analytical Services) was released over 20 years ago.
The OLAP method of data analysis requires two steps:
- Create an OLAP database (Excel calls this a Data Model).
- Use reporting tools to analyse and visualize the data residing in the Data Model.
All current versions of Excel for Windows (Excel 2019, Excel 2021 and Excel 365) now include Power Pivot and are capable of performing OLAP data analysis. The OLAP enabled tools are:
Tools to create a data model:
- Get & Transform (previously named: Power Query). A tool for cleaning (transforming) source data and loading the cleaned data into Power Pivot tables. You can find an explanation of what this tool does here.
- Power Pivot. A tool used to take the data tables that Get & Transform has pre-prepared and define relationships between them to create data models (also called OLAP databases). You can find an explanation of what this tool does here.
Tools to analyze and visualize the data residing in the data model:
- 3-D Maps (previously named: Power Maps). An easy-to-learn application that provides a way to visualize geographical data contained in a data model. You can learn more about how 3-D Maps uses a data model here.
- OLAP Pivot Table. An easy-to-learn analytical tool that is able to present the summarized data contained in a data model. You can find an in-depth explanation of the differences between regular pivot tables and OLAP pivot tables here.
- Excel itself. Excel is able to directly access summarized data residing in a data model. Excel’s extensive analysis, charting and other visualization features can then be used to further refine a report or visualization. You can find an explanation of how this can be done here.
Business Intelligence (BI)
Business Intelligence is a very broad term that was first used in 1865 to describe how the banker Sir Henry Furnese prospered by receiving and acting upon information before his contemporaries.
When IT professionals talk about Business Intelligence (BI) today, they usually mean the instant analysis and presentation of data sourced from an OLAP database (data model) to support timely business decisions.
Most users do not need a lot of training to benefit from Business Intelligence
Get & Transform and Power Pivot are sophisticated tools that enable IT professionals to create data models. A good understanding of relational database theory is needed to use them.
The tools used to analyze and present data residing in a data model (3-D Maps, OLAP Pivot Tables and Excel) are designed as easy-to-learn tools that most users can quickly master.

OLAP skills are extremely rare amongst IT staff (and highly valued)
It has been estimated that only 10% of Excel users are able to use regular Excel pivot tables. It likely that far less than 1% of Excel users will develop the skills needed to create correctly designed data models. Because OLAP skills are so rare they are highly valued by employers.
Excel Power Pivot has a similar "look and feel" to Excel
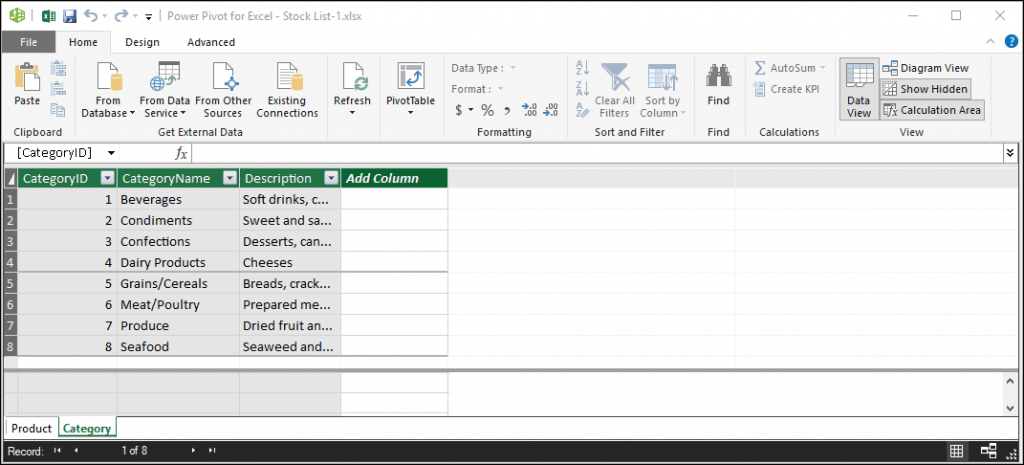
In the screen shot below you can see that the Power Pivot user interface has some similarities to Excel. Tables that have been imported look very much like Excel tables and a familiar tab-strip enables you to select a table as if it were located on a worksheet. But, of course, Power Pivot is an entirely different application that has an entirely different purpose. Power Pivot tables have little in common with Excel tables. You can find an explanation of the differences between Power Pivot tables and Excel tables here.
An OLAP database (or data model) is very different to a regular database
Most corporate data is held in a relational database (like SQL Server, Oracle and Access). Relational databases consist of a series of tables linked by relationships. You can find an explanation of how table relationships are created here.
Relational databases are really good at Finding, Adding, Deleting and Editing rows of data stored in tables. This type of database is called an OLTP database (OnLine Transaction Processing). You can find an explanation of how OLTP databases are designed here.
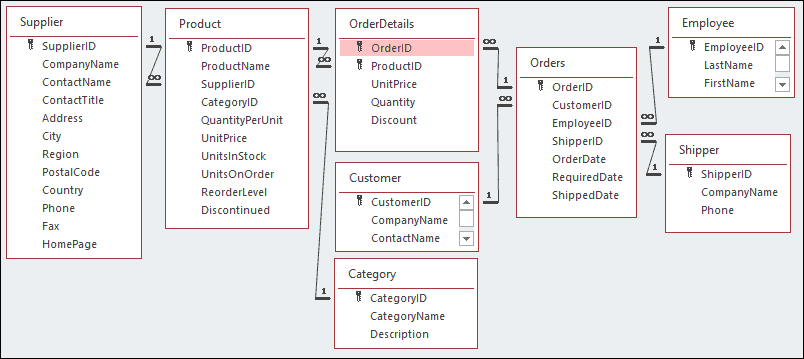
For reporting and analyzing data you need a different type of database called an OLAP database (OnLine Analytical Processing). OLAP databases are wonderful for quickly creating summary reports (even when there are millions of rows of source data). Power Pivot calls this type of database a Data Model.
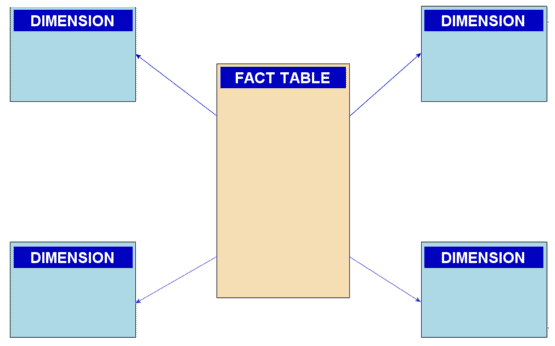
The OLAP database (data model) shown above is a lot simpler than the OLTP database from which it was created. It is really easy to analyze data once it has been converted into a properly-constructed data model. You can find an explanation of how OLAP databases are designed here.
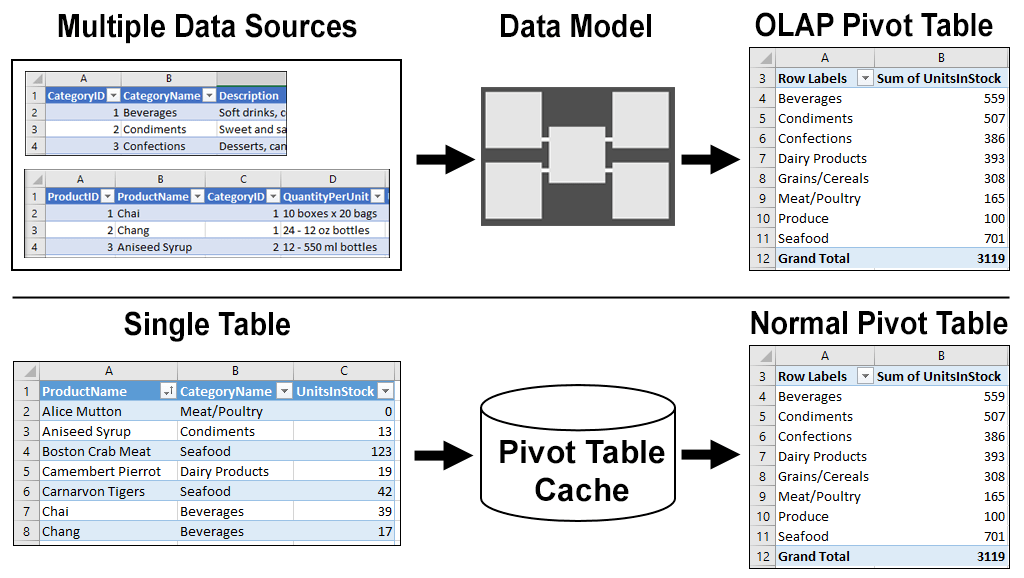
Once a Data Model has been created, even unsophisticated users can use an OLAP Pivot Table (a new type of pivot table, hosted within Excel, that uses a data model as its source data) to quickly and intuitively analyze data. Microsoft sometimes call this new way of working: Modern Data Analysis. You can find an explanation of how Modern Data Analysis differs from Classic Data Analysis here.
What is DAX?
DAX is an acronym for Data Analysis Expressions.
DAX is a collection of over 200 functions that can be used when creating a data model. Data models often need to have aggregate fields that are calculated from the information in the source data. This type of field (called a calculated measure) can be easily added to the data model using one or more DAX functions.
While calculated measures are really no more complex than regular Excel functions there are many DAX-related concepts that need to be mastered to use them effectively (such as row and filter context and implicit and explicit measures).
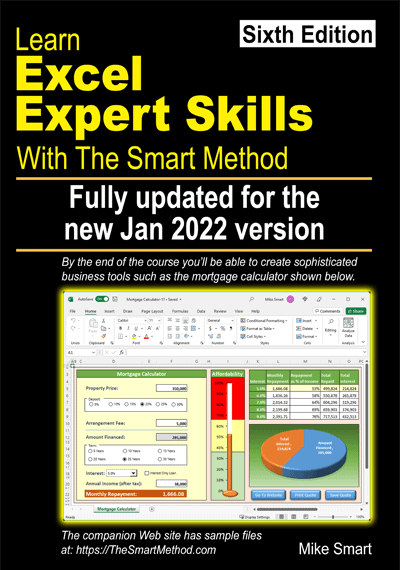
This lesson is excerpted from the above book.
This is the only up-to-date Excel book currently published and includes an entire session devoted to the new Dynamic Arrays features.
It is also the only book that will teach you absolutely every Excel skill including Power Pivot, OLAP and DAX.
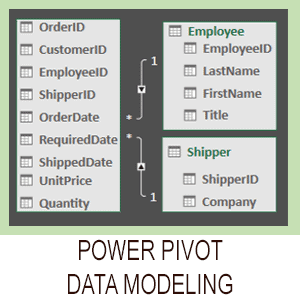
Covered in Session 12 – Power Pivot, Data Modelling, OLAP and Business Intelligence

Covered in Lesson 12-20: Use the CUBEVALUE function to query a data model.
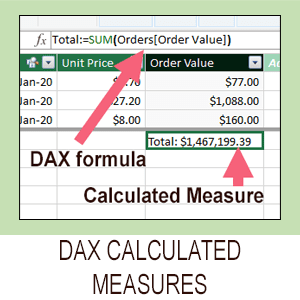
Covered in Session 13: An Introduction to DAX
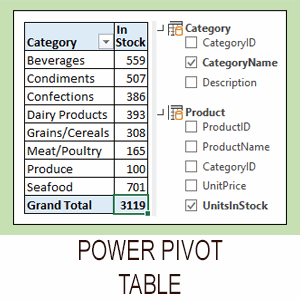
Covered in Lesson 12-6: Use an OLAP pivot table to analysze data residing in a data model.
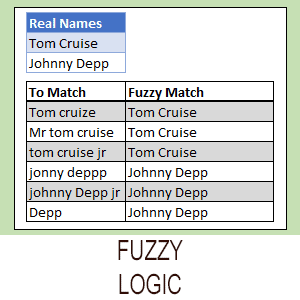
Covered in Lesson 11-33 Create a merged query using fuzzy logic.
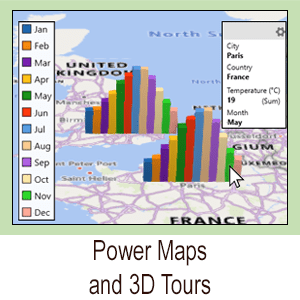
Covered in Session 10: 3D Maps.
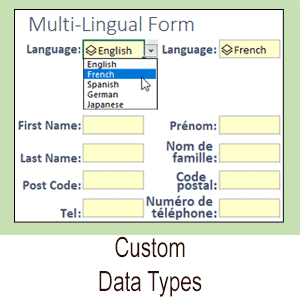
Covered in Lesson 11-7: Create and use a custom data type.
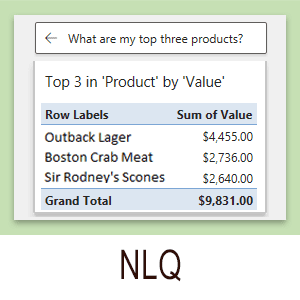
Covered in Lesson 9-2: Use Natural Language Queries.

Covered in Lesson 11-8: Use custom data types in formulas.
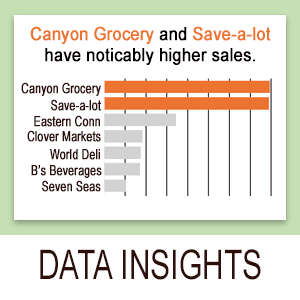
Covered in Lesson 9-1: Use automatic data analysis to create data insights.
Related Articles

Excel modern data analysis
This article describes a new way of working with Excel called “modern data analysis” enabled by the new Get & Transform and Power Pivot tools.
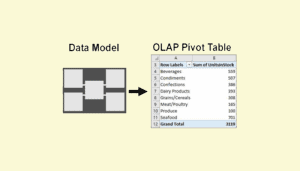
Excel OLAP pivot tables
This article explains the difference between a regular Excel pivot table and the new OLAP pivot table used by Power Pivot.

Excel Power Pivot window
This lesson discusses the Power Pivot window and how it differs from the regular Excel window. A sample file is included.

Excel Get & Transform overview
Get & Transform (or Power Query) is an advanced ETL tool. ETL is an acronym for Extract, Transform and Load. This article simply explains this amazing tool.
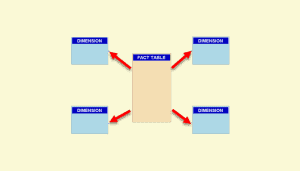
Excel data model Design
A Power Pivot data model is an OLAP database. OLAP databases can be modeled as a Snowflake or Star schema. This article explains both designs.
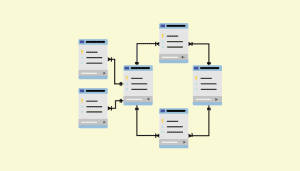
Understand OLTP database design
A Power Pivot data model is an OLAP database. Business databases are OLTP databases. This article discusses how OLTP databases are structured.
2 Responses
Good, simple breakdown. And, it’s difficult to find good explanations of power pivot in the “mine of misinformation” lol
This is a good introduction. Thanks.