This article explains how the Excel CUBEVALUE function can be used to extract data from an Excel data model.
An Excel data model is a type of OLAP database. If you have no understanding of OLAP I recommend that you begin with my Excel Power Pivot 2-minute overview article first. That puts the whole subject of OLAP and Power Pivot into context and then the lesson below will make a lot more sense.
In 2019 Microsoft added Power Pivot to Excel making it a credible OLAP tool. Power Pivot enabled any Excel users with the right training to create a perfect OLAP database – in Excel terminology a Data Model.
The article below is an unedited lesson from one of the 68 short focused lessons in my Excel Expert Skills book/e-book that seeks to empower any Excel user with a complete mastery of the skills needed to create perfect Excel data models from both Excel workbook data and external data sources.
Leave me a comment if you find the article useful.
- Excel 365
- Excel 2019
- Excel 2016
- Last Updated: September 6, 2020
note
Why does the Excel CUBEVALUE function have the prefix CUBE?
It is common to teach and visualize OLAP concepts in the context of an imaginary three-dimensional OLAP Cube.
The imaginary cube is a little like a Rubik’s cube but contains a set of aggregated values in each cell.

OLAP concepts are taught in the context of Slicing, Dicing and Rotating (Pivoting) the cube of data.
MDX queries (created by the CUBE functions) retrieve aggregated totals from specified cells (intersections of three values) from a cube of data.
note
The GETPIVOTDATA function is also supported by OLAP pivot tables
In: Lesson 9‑23: Use the GETPIVOTDATA function, you learned how to use the GETPIVOTDATA function to access values in a regular pivot table from outside the pivot table.
The GETPIVOTDATA function can only be used to reference values that are visible in a pivot table.
This can be a huge problem, as a user may change the fields displayed in a pivot table, causing functions that use the GETPIVOTDATA function to fail.
If there were a function that directly accessed data from the pivot table data cache (that regular pivot tables use instead of the data model) this problem would be overcome.
Unfortunately, there is no way to do this in a regular pivot table.
The Excel CUBEVALUE function has none of these problems as data is accessed directly from the data model without any interaction with a pivot table.
OLAP pivot tables still support the GETPIVOTDATA function but you’ll probably prefer to use Excel CUBEVALUE functions in their place when working with data that originates in a data model.
Lesson 12 20: Use the Excel CUBEVALUE function to query a data model
In: Lesson 9‑23: Use the GETPIVOTDATA function, you discovered a way to reference data that is visible on the screen within a pivot table.
If you’ve completely understood this session so far, you’ll now realize that an OLAP pivot table is simply a visual and user-friendly way to display, format and present the values stored in a data model.
The Excel CUBEVALUE function enables you to obtain values directly from the data model without a pivot table. This opens up many new possibilities when presenting and formatting data.
1. Open the Stock List-4 sample file in Excel
This workbook contains the pivot table that you created from a data model in: Lesson 12‑6: Use an OLAP pivot table to analyze data residing in a data model.
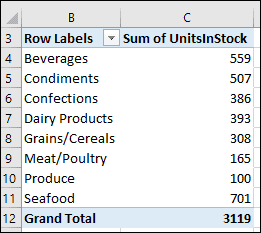
2. Attempt to insert a column or row within the pivot table.
Notice that (as with all pivot tables) this isn’t possible.
When you attempt to insert a row or column, a warning dialog is shown:

3. Convert the pivot table into a set of Excel CUBEVALUE functions.
- Click inside the pivot table to activate it.
- Click: PivotTable Analyze>Calculations->OLAP Tools->
Convert to Formulas
(This option is grayed out when working with regular pivot tables).
Notice that the OLAP pivot table no longer exists but the data previously displayed remains:
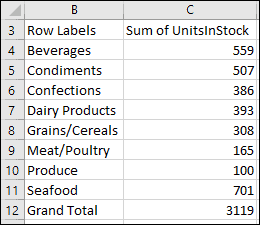
Each value is now directly accessed from the data model using Excel CUBEVALUE functions.
4. Examine the Excel CUBEVALUE function for the Sum of UnitsInStock column in the Beverages category.
- Click once in cell C4.
- Look at the function displayed in the formula bar:
=CUBEVALUE(“ThisWorkbookDataModel”,$B4,C$3
The first argument identifies the name of the connection to the data model. In this case it is the data model that you defined in: Lesson 12‑3: Add tables to a data model and Lesson 12‑5: Add a relationship to a data model using Power Pivot.
The last two arguments are MDX expressions. You learned about the MDX query language in: Lesson 12‑19: Understand MDX queries and OLAP pivot table limitations.
- Click on cell B4 and C3 to see how the MDX expressions have been created.
With your understanding of data models, you should be able to broadly understand how the references work.You have used an OLAP pivot table to automatically create the MDX code for you. This technique allows you to create Excel CUBEVALUE functions without any understanding of the MDX language.
5. Insert a column before column C and a row before row 5.
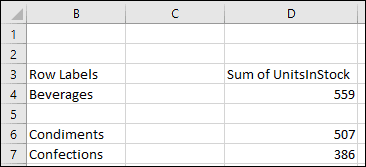
There is now no barrier to inserting rows and columns, as each cell contains a normal function.
You can also format the values in any way you wish.
6. Save your work as Stock List-5.

This lesson is excerpted from the above book.
This is the only up-to-date Excel book currently published and includes an entire session devoted to the new Dynamic Arrays features.
It is also the only book that will teach you absolutely every Excel skill including Power Pivot, OLAP and DAX.
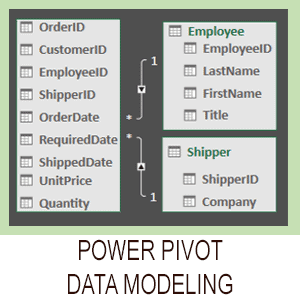
Covered in Session 12 – Power Pivot, Data Modelling, OLAP and Business Intelligence

Covered in Lesson 12-20: Use the CUBEVALUE function to query a data model.
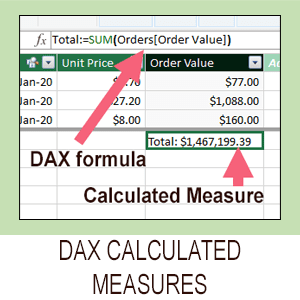
Covered in Session 13: An Introduction to DAX
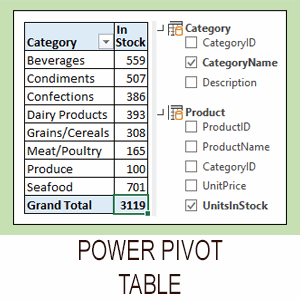
Covered in Lesson 12-6: Use an OLAP pivot table to analysze data residing in a data model.

Covered in Lesson 11-33 Create a merged query using fuzzy logic.
Covered in Session 10: 3D Maps.
Covered in Lesson 11-7: Create and use a custom data type.
Covered in Lesson 9-2: Use Natural Language Queries.

Covered in Lesson 11-8: Use custom data types in formulas.

Covered in Lesson 9-1: Use automatic data analysis to create data insights.
Related Articles

Excel Power Pivot – 2 minute overview
Power Pivot causes great confusion. This simple 2-minute overview completely de-mystifies Power Pivot and its associated technologies.

Excel modern data analysis
This article describes a new way of working with Excel called “modern data analysis” enabled by the new Get & Transform and Power Pivot tools.
Excel OLAP pivot tables
This article explains the difference between a regular Excel pivot table and the new OLAP pivot table used by Power Pivot.

Excel Power Pivot window
This lesson discusses the Power Pivot window and how it differs from the regular Excel window. A sample file is included.
Excel data model Design
A Power Pivot data model is an OLAP database. OLAP databases can be modeled as a Snowflake or Star schema. This article explains both designs.

Understand OLTP database design
A Power Pivot data model is an OLAP database. Business databases are OLTP databases. This article discusses how OLTP databases are structured.
