The construct that Excel describes as an Excel Data Model is actually an OLAP database. Excel users can use the Power Pivot tool to create a perfect Excel Data Model design.
If you are new to OLAP and data modeling I recommend that you read my Excel Power Pivot 2-minute overview article first. That article puts the whole subject of OLAP into context and will make the lesson below make a lot more sense.
The article below is an unedited lesson from one of the 68 short focused lessons in my Excel Expert Skills book/e-book that seeks to empower any Excel user with the skills needed to create a perfect data model design.
Leave me a comment if you find the article useful.
- Excel 365
- Excel 2019
- Excel 2016
- Last Updated: September 7, 2020
note
Fact and Dimension tables
A perfect Excel data model design contains one Fact table and several Dimension tables.
Fact table
The Fact table is the central table that (ideally) contains nothing but values and foreign keys (that are used to define relationships to the dimension tables).
The values in the fact table can be aggregated into the values displayed in the body of pivot tables.
The best-practice rule:
Only store numerical data and foreign keys in the fact table.
… is included in: Appendix A: Power Pivot Rules.
Dimension tables
Dimensions can be thought of as filters. They contain fields that will be used for the row, column, filter and slicer names in pivot tables.
Data models with many dimensions add more flexibility but increase the data model size
There is always a trade-off between reporting flexibility and the data model size.
note
Other names for dimension and fact tables
Some users prefer the term Lookup table (for dimension tables) and Data table (for fact tables).
Lesson 12-12: Understand Excel data model design
OLAP databases and OLTP databases are designed differently
OLTP design criteria
In: Lesson 12‑11: Understand OLTP database design you learned that an OLTP (On Line Transaction Processing) database is designed around the need to quickly perform four actions: Create, Retrieve, Update and Delete.
Well-designed OLTP databases must also conform to Third Normal Form (3NF) and are said to contain Normalized Data. A normalized database reduces the risk of data corruption during transactional processing. You learned a little about 3NF in: Lesson 11‑31: Understand normal and de-normalized data.
OLTP databases can contain one-to-many and many-to-many relationships. You learned about relationship types in: Lesson 12‑10: Understand many-to-many relationships.
Excel data model design criteria
The Excel data model design that you create in Power Pivot is an OLAP (On Line Analytical Processing) database. An OLAP database is read-only and has no need to Create, Retrieve, Update and Delete records. Instead it is designed around the need to quickly analyze data.
Data analysis is most easily performed using a special table and relationship arrangement called a Star or Snowflake schema that has a central Fact table surrounded by several Dimension tables.
OLAP databases used with Power Pivot cannot contain many-to-many relationships.
Because OLAP databases do not process transactions they have no need to conform to third normal form. For this reason several dimension tables are often de-normalized into a single dimension table.
Snowflake schema
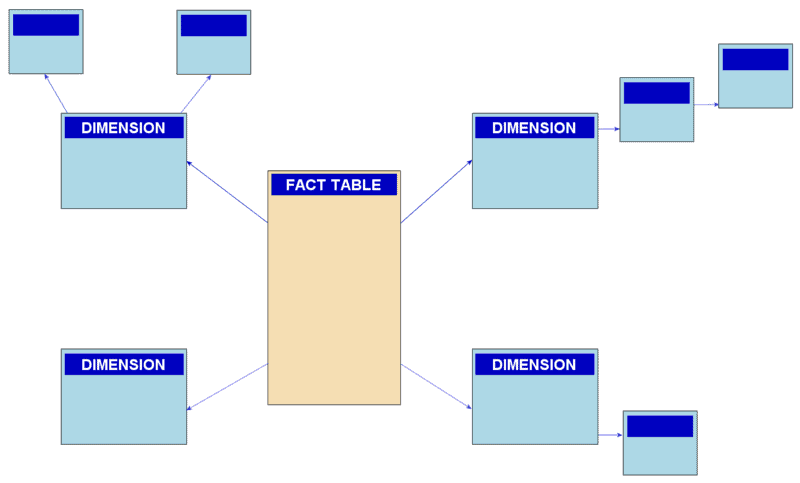
A Snowflake schema has a central Fact table surrounded by several Dimension tables.
Notice that some of the dimension tables have sub-dimensions giving the schema the appearance of a snowflake.
You can think of the dimension tables as filters that enable aggregations of the values in the fact table.
Star schema (the best Excel data model design)
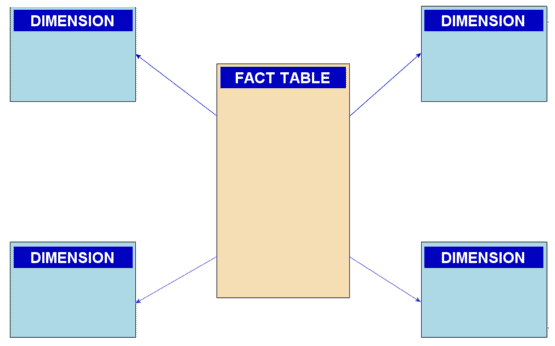
In the above diagram, you can see that a star schema has only one level of dimension tables, giving the schema the appearance of a star.
While Power Pivot will work with either a snowflake or star schema, Power Pivot works faster and better with a star schema. Star schemas are also easier for users to work with.
For these reasons the star schema is the recommended choice when working with Power Pivot.
The best-practice rule:
Use a star schema (rather than a snowflake schema) when constructing data models.
The best-practice rule:
Use a star schema (rather than a snowflake schema) when constructing data models.
… is included in: Appendix A: Power Pivot Rules.
Creating a star schema from an OLTP database
To create an OLAP star schema database from an OLTP database it is first necessary to create a snowflake schema database by converting any many-to-many relationships into one-to-many relationships. You’ll do this later, in: Lesson 12‑14: Create a snowflake data model from a relational database.
The snowflake schema can then be converted into a star schema by de-normalizing any chains of dimension tables into single dimension tables. You’ll do this later in: Lesson 12‑15: Convert a snowflake data model into a star data model.
This lesson is excerpted from the above book.
This is the only up-to-date Excel book currently published and includes an entire session devoted to the new Dynamic Arrays features.
It is also the only book that will teach you absolutely every Excel skill including Power Pivot, OLAP and DAX.
Covered in Session 12 – Power Pivot, Data Modelling, OLAP and Business Intelligence
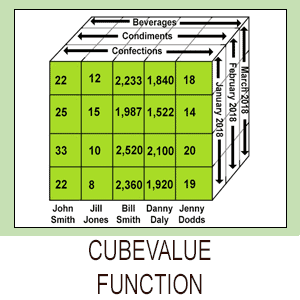
Covered in Lesson 12-20: Use the CUBEVALUE function to query a data model.
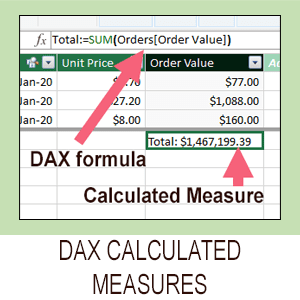
Covered in Session 13: An Introduction to DAX
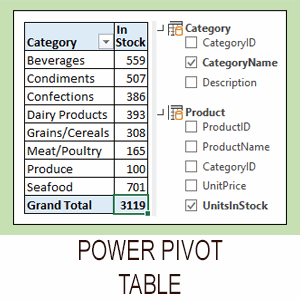
Covered in Lesson 12-6: Use an OLAP pivot table to analysze data residing in a data model.
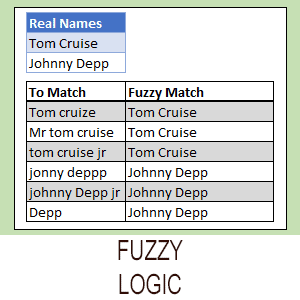
Covered in Lesson 11-33 Create a merged query using fuzzy logic.
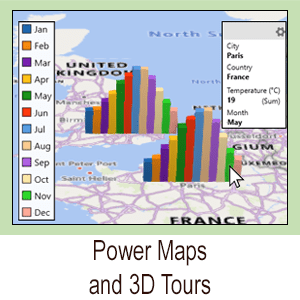
Covered in Session 10: 3D Maps.
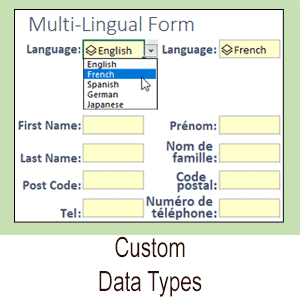
Covered in Lesson 11-7: Create and use a custom data type.
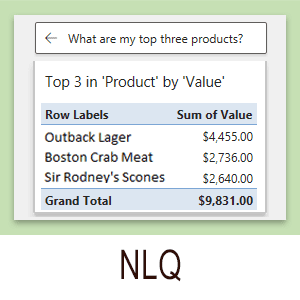
Covered in Lesson 9-2: Use Natural Language Queries.

Covered in Lesson 11-8: Use custom data types in formulas.

Covered in Lesson 9-1: Use automatic data analysis to create data insights.
Related Articles

Excel Power Pivot – 2 minute overview
Power Pivot causes great confusion. This simple 2-minute overview completely de-mystifies Power Pivot and its associated technologies.

Excel modern data analysis
This article describes a new way of working with Excel called “modern data analysis” enabled by the new Get & Transform and Power Pivot tools.
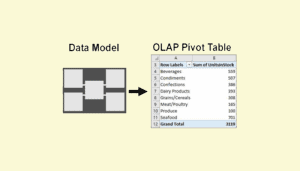
Excel OLAP pivot tables
This article explains the difference between a regular Excel pivot table and the new OLAP pivot table used by Power Pivot.

Excel Power Pivot window
This lesson discusses the Power Pivot window and how it differs from the regular Excel window. A sample file is included.
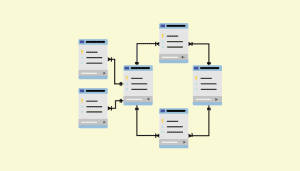
Understand OLTP database design
A Power Pivot data model is an OLAP database. Business databases are OLTP databases. This article discusses how OLTP databases are structured.
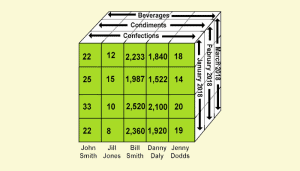
Excel CUBEVALUE function
This lesson shows how to use the CUBEVALUE function to make an OLAP pivot table directly access the data model. Includes sample file.
