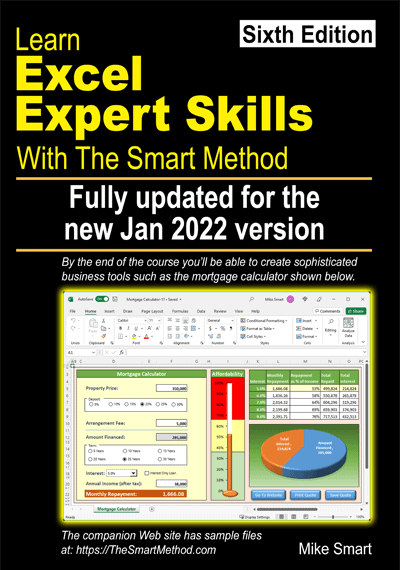
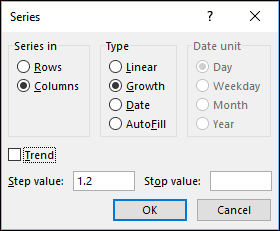
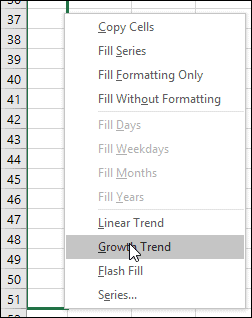
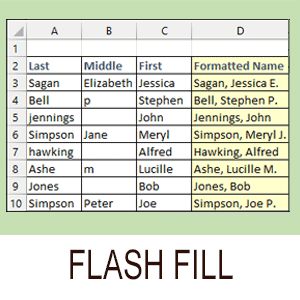


Keyboard shortcut for autofill in Excel
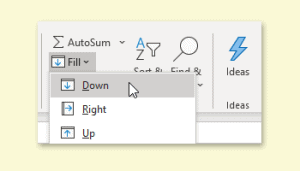
This article explains several different ways to carry out an AutoFill using the keyboard in Excel and explains Flash Fill and the Repeat command.
This article explains several different ways to carry out an AutoFill using the keyboard in Excel and explains Flash Fill and the Repeat command.