- Excel 365
- Excel 2021
- Excel 2019
- Excel 2016
- February 12, 2022
- No Comments
Handling zero values in Excel charts can be a challenge, because the settings that control how zeroes are handled can be quite hard to find.
If you want to improve your knowledge of Excel charts, you could benefit greatly from our Essential Skills Books and E-books.
There are a few questions that we often receive regarding zero values in charts.
How to hide all zero values from a chart
Sometimes you might simply want to hide any zero values from your chart, preventing them from appearing at all.
The easiest way to do this is to filter your data before you create the chart. Filters are those gray arrows that appear at the top of columns in Excel. If your data doesn’t have filters, you can switch them on by clicking Data > Sort & Filter > Filter on the Excel Ribbon.

You can filter out the zero values by unchecking the box next to 0 in the filter drop-down.
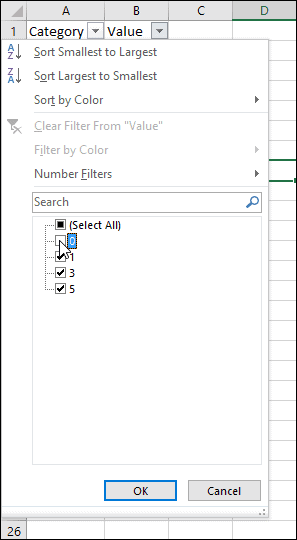
After you click OK all of the zero values disappear (although you can always bring them back using the same filter).
If you create a chart from the filtered data it will not show any of the zero values.
How to make empty cells appear as gaps or zeros
Filtering out the zeros as shown above actually does the same thing as if you hid the cells that contained the zero values.
Excel charts have options that control how they will respond to hidden and empty cells. Cells that are left blank are treated as empty cells.
To access these options, select the chart and click:
Chart Tools > Design > Select Data > Hidden and Empty Cells
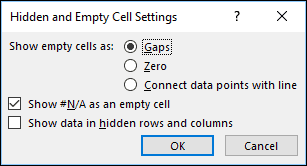
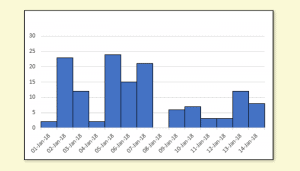
You can use these settings to control whether empty cells are shown as gaps or zeros on charts. With Line charts you can choose whether the line should connect to the next data point if a hidden or empty cell is found.
If you are using Excel 365 you may also see the Show #N/A as an empty cell option. This allows you to control whether charts treat #N/A errors as empty cells.
The final checkbox lets you tell Excel that it should display data that is in hidden rows or columns. You might select this option if you wanted to filter your data without affecting the chart.
All of these settings are covered in much greater depth in our Essential Skills books and E-books. If you want to improve your Excel skills they could be extremely useful to you.
These are the only up-to-date Excel books currently published and includes the new Dynamic Arrays features.
They are also the only books that will teach you absolutely every Excel skill including Power Pivot, OLAP and DAX.
Some of the things you will learn
