Here are just a few of the things you will learn with this book.
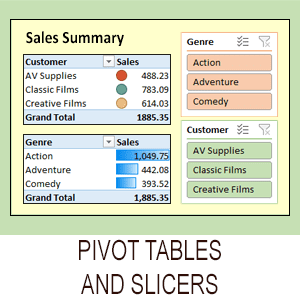
It is often said that the ability to fully understand Pivot Tables separates competent Excel users from Excel novices. The above grab shows two pivot tables and two slicers combined into a dashboard. The book will teach you absolutely everything there is to know about Pivot Tables. including slicers, calculated fields, calculated items, grouping, filter fields and multiple summations.
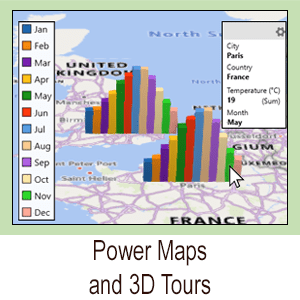
The core idea behind Power Maps (also known as 3D Maps) is to show visualizations of Excel data upon the surface of a map but this doesn’t begin to describe the huge feature set of this powerful Excel tool.
The book covers Power Maps in depth and that includes geocoding, data cards, multiple layers, annotations, scenes and fly-pasts. You’ll even create a HD video as you fly over your data.
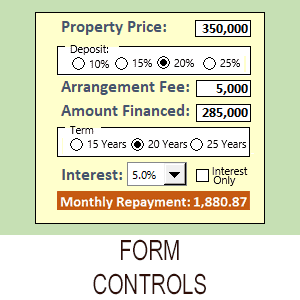
The above form was created in a few minutes using Excel’s simple-to-use Form Controls.
This book will teach you how to add Option Buttons, Check Boxes, Combo Boxes, Spin Buttons, Buttons and many other controls. Once added they are really easy to bring to life. The screen grab above shows a Mortgage Calculator that you’ll create in one of the book’s sessions.
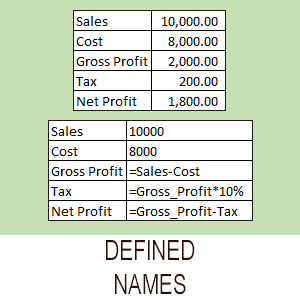
Excel Names make cell references easy to read in formulas. In the above example the formula =Sales-Cost leaves no room for error.
The book will teach you all there is to know about names and that includes single-cell names, range names, two-dimensional range names, dynamic formula-based names and named constants.
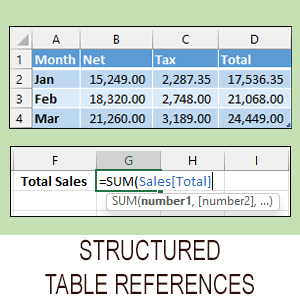
Excel Experts don’t use old-fashioned A1 style references when referencing dynamic data. They use tables and modern structured table references.
The book will teach you the professional way to work with tables and structured references and not ranges and A1 style references.
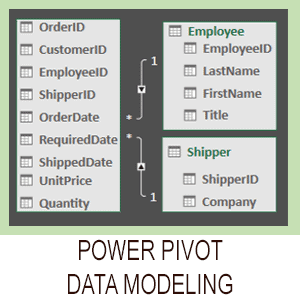
Excel only supports a million rows, but when Excel teams with Power Pivot, Excel can analyse billions of rows of data in the blink of an eye using a Power Pivot Data Model.
The book will teach you to create the special Star Schema data models required by Excel using Power Query and Power Pivot. This new way of working is often called Modern Data Analysis.
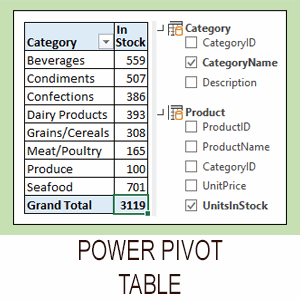
This isn’t an ordinary Excel pivot table – it’s an Excel Power Pivot Table (also called an OLAP Pivot Table). You can see that it can analyse multiple related tables.
The book will teach you how to prepare the relational data models needed to work with Power Pivot tables. You’ll then have the power to work faster and smarter than ever before.
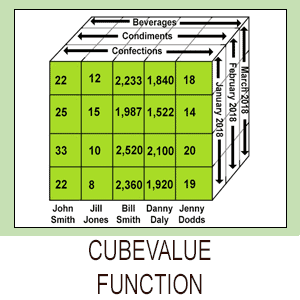
Excel can directly access the aggregated data that resides within a Power Pivot data model using the CUBEVALUE function.
This book will teach you how to automatically and instantly create CUBEVALUE functions with their associated MDX queries so that you can access aggregations within a Power Pivot data model directly from an Excel worksheet.
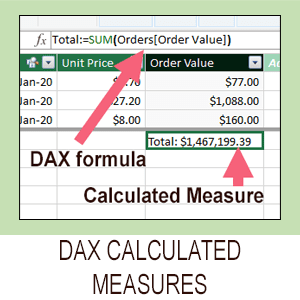
DAX functions are very different to Excel functions but you’ll find many that are named just like their Excel counterparts.
The book will teach you important DAX concepts including calculated columns, calculated measures, implicit measures, explicit measures, row and filter context and the DISTINCOUNT , CALCULATE and ALL functions.